Degree Diameter Problem
Author
Eric W. Weisstein
Title
Degree Diameter Problem
Description
Degree Diameter Problem
Category
Educational Materials
Keywords
URL
http://www.notebookarchive.org/2019-07-0z3u07e/
DOI
https://notebookarchive.org/2019-07-0z3u07e
Date Added
2019-07-02
Date Last Modified
2019-07-02
File Size
9.91 megabytes
Supplements
Rights
Redistribution rights reserved

Degree Diameter Problem
Degree Diameter Problem
Author
Author
Eric W. Weisstein
July 3, 2018
July 3, 2018
This notebook downloaded from http://mathworld.wolfram.com/notebooks/GraphTheory/DegreeDiameterProblem.nb.
For more information, see Eric's MathWorld entry http://mathworld.wolfram.com/DegreeDiameterProblem.html.
©2018 Wolfram Research, Inc. except for portions noted otherwise
Links
Links
Optimal
Optimal
In[]:=
data=Select[GraphData[{"Regular","Nonplanar"}],!FreeQ[GraphData[#,"StandardNames"],"LargestRegularNonplanarDiameter"]&]
Out[]=
{HoffmanSingletonGraph,PetersenGraph,{RegularNonplanarDiameter,{3,3,20}},{RegularNonplanarDiameter,{3,4,38}},{RegularNonplanarDiameter,{4,2,15}},{RegularNonplanarDiameter,{5,2,24}},{RegularNonplanarDiameter,{6,2,32}}}
In[]:=
TextGrid[Sort[GraphData[#,{"MaximumVertexDegree","Diameter","VertexCount","#"}]&/@data],DividersAll,Alignment{{{Decimal},Left}}]
Out[]=
3 | 2 | 10 | PetersenGraph |
3 | 3 | 20 | {RegularNonplanarDiameter,{3,3,20}} |
3 | 4 | 38 | {RegularNonplanarDiameter,{3,4,38}} |
4 | 2 | 15 | {RegularNonplanarDiameter,{4,2,15}} |
5 | 2 | 24 | {RegularNonplanarDiameter,{5,2,24}} |
6 | 2 | 32 | {RegularNonplanarDiameter,{6,2,32}} |
7 | 2 | 50 | HoffmanSingletonGraph |
Largest known
Largest known
Cubic
Cubic
Summary
Summary
Table
Table
In[]:=
TextGrid[data=SplitBy[Sort[GraphData[#,{"Diameter","V","#"}]&/@GraphData[{"Cubic","Nonplanar"}]],First][[All,-1]],DividersAll,Alignment{{{Decimal},Left}}]
Out[]=
2 | 10 | PetersenGraph |
3 | 20 | {RegularNonplanarDiameter,{3,3,20}} |
4 | 38 | {RegularNonplanarDiameter,{3,4,38}} |
5 | 70 | {RegularNonplanarDiameter,{3,5,70}} |
6 | 132 | {RegularNonplanarDiameter,{3,6,132}} |
7 | 196 | {RegularNonplanarDiameter,{3,7,196}} |
8 | 336 | {RegularNonplanarDiameter,{3,8,336}} |
9 | 600 | {RegularNonplanarDiameter,{3,9,600}} |
10 | 816 | Foster816G |
11 | 936 | Foster936C |
12 | 960 | Foster960C |
13 | 896 | Foster896B |
14 | 936 | Foster936A |
15 | 896 | {CubeConnectedCycle,7} |
16 | 864 | Foster864B |
17 | 784 | Foster784A |
18 | 2048 | {CubeConnectedCycle,8} |
19 | 976 | Foster976A |
20 | 912 | Foster912B |
21 | 662 | Foster662A |
22 | 726 | Foster726A |
23 | 794 | Foster794A |
24 | 864 | Foster864A |
25 | 938 | Foster938B |
26 | 942 | Foster942A |
27 | 962 | Foster962B |
28 | 978 | Foster978A |
29 | 998 | Foster998A |
∞ | 20 | 2P |
Graphic
Graphic
In[]:=
GraphicsGrid[Partition[Show[GraphData[#]//StyleGraphs,PlotLabelTextCell[Style[GraphData[#,"Name"],Directive[Italic,FontFamily"Times"]],TextAlignmentCenter,PageWidth150]]&/@data[[;;9,-1]],UpTo[3]],ImageSize600]
Out[]=

3-3 (optimal; 20 vertices) [LCF all known]
3-3 (optimal; 20 vertices) [LCF all known]
3-4 (optimal; 38 vertices) [LCF all known]
3-4 (optimal; 38 vertices) [LCF all known]
3-5 (best known; 70 vertices) [LCF all known]
3-5 (best known; 70 vertices) [LCF all known]
3-6 (nonoptimal: 70 vertices)
3-6 (nonoptimal: 70 vertices)
3-6 Exoo (best known; 132 vertices) [no LCF known]
3-6 Exoo (best known; 132 vertices) [no LCF known]
3-7 Exoo (best known; 196 vertices) [no LCF known]
3-7 Exoo (best known; 196 vertices) [no LCF known]
3-8 Exoo (best known; 336 vertices)
3-8 Exoo (best known; 336 vertices)
3-9 Exoo (best known; 600 vertices)
3-9 Exoo (best known; 600 vertices)
3-10 (best known; 1250 vertices)
3-10 (best known; 1250 vertices)
Quartic
Quartic
Summary
Summary
Table
Table
In[]:=
TextGrid[data=SplitBy[Sort[GraphData[#,{"Diameter","V","#"}]&/@GraphData[{"Quartic","Nonplanar"}]],First][[All,-1]],DividersAll,Alignment{{{Decimal},Left}}]
Out[]=
1 | 5 | PentatopeGraph |
2 | 15 | {RegularNonplanarDiameter,{4,2,15}} |
3 | 41 | {RegularNonplanarDiameter,{4,3,41}} |
4 | 98 | {RegularNonplanarDiameter,{4,4,98}} |
5 | 67 | {Cage,{4,7}} |
6 | 728 | {Cage,{4,12}} |
7 | 70 | {BipartiteKneser,{7,3}} |
8 | 81 | {TorusGrid,{9,9}} |
9 | 90 | {Circulant,{90,{9,10}}} |
10 | 168 | TetrahedronReplacedCoxeterLineGraph |
15 | 600 | HundredTwentyCellGraph |
∞ | 20 | {Circulant,{20,{2,8}}} |
Graphic
Graphic
In[]:=
GraphicsGrid[Partition[Show[GraphData[#]//StyleGraphs,PlotLabelTextCell[Style[GraphData[#,"Name"],Directive[Italic,FontFamily"Times"]],TextAlignmentCenter,PageWidth150]]&/@data[[;;4,-1]],UpTo[3]],ImageSize600]
Out[]=

4-2 K3*C5 (optimal; 15 vertices) [LCF all known]
4-2 K3*C5 (optimal; 15 vertices) [LCF all known]
4-3 Allwright (best known; 41 vertices) [LCF all known]
4-3 Allwright (best known; 41 vertices) [LCF all known]
4-4 Exoo (best known; 98 vertices) [no LCF known]
4-4 Exoo (best known; 98 vertices) [no LCF known]
4-5 H'3 (best known; 364 vertices)
4-5 H'3 (best known; 364 vertices)
4-6 H3(K3) (best known; 740 vertices)
4-6 H3(K3) (best known; 740 vertices)
4-7 Exoo (nonoptimal; 1296 vertices)
4-7 Exoo (nonoptimal; 1296 vertices)
4-7 (best known; 1320 vertices)
4-7 (best known; 1320 vertices)
4-8 Exoo (nonoptimal; 3087 vertices)
4-8 Exoo (nonoptimal; 3087 vertices)
4-8 (best known; 3243 vertices)
4-8 (best known; 3243 vertices)
4-9 (best known; 7575 vertices)
4-9 (best known; 7575 vertices)
4-10 (best known; 17703 vertices)
4-10 (best known; 17703 vertices)
Quintic
Quintic
Summary
Summary
Table
Table
In[]:=
TextGrid[data=SplitBy[Sort[GraphData[#,{"Diameter","V","#"}]&/@GraphData[{"Quintic","Nonplanar"}]],First][[All,-1]],DividersAll,Alignment{{{Decimal},Left}}]
Out[]=
1 | 6 | {Complete,6} |
2 | 24 | {RegularNonplanarDiameter,{5,2,24}} |
3 | 72 | {RegularNonplanarDiameter,{5,3,72}} |
4 | 212 | {RegularNonplanarDiameter,{5,4,212}} |
5 | 624 | {RegularNonplanarDiameter,{5,5,624}} |
6 | 2730 | {Cage,{5,12}} |
7 | 720 | {PermutationStar,{6,5}} |
∞ | 20 | {Circulant,{20,{4,8,10}}} |
Graphic
Graphic
In[]:=
GraphicsGrid[Partition[Show[GraphData[#]//StyleGraphs,PlotLabelTextCell[Style[GraphData[#,"Name"],Directive[Italic,FontFamily"Times"]],TextAlignmentCenter,PageWidth150]]&/@data[[;;5,-1]],UpTo[3]],ImageSize600]
Out[]=

5-2 K3*X8 (optimal; 24 vertices) [LCF all known]
5-2 K3*X8 (optimal; 24 vertices) [LCF all known]
5-3 Exoo (best known; 72 vertices) [one order-3 LCF known]
5-3 Exoo (best known; 72 vertices) [one order-3 LCF known]
5-4 Exoo (best known; 212 vertices) [no LCF known]
5-4 Exoo (best known; 212 vertices) [no LCF known]
5-5 Exoo (nonoptimal; 620 vertices) [no LCF known]
5-5 Exoo (nonoptimal; 620 vertices) [no LCF known]
5-5 Loz_624 (best known; 624 vertices) [no LCF known]
5-5 Loz_624 (best known; 624 vertices) [no LCF known]
5-6 H_4(K_3) (best known; 2 772 vertices)
5-6 H_4(K_3) (best known; 2 772 vertices)
5-7 (best known; 5 516 vertices)
5-7 (best known; 5 516 vertices)
5-8 (best known; 17030 vertices)
5-8 (best known; 17030 vertices)
Sextic
Sextic
Summary
Summary
Table
Table
In[]:=
TextGrid[data=SplitBy[Sort[GraphData[#,{"Diameter","V","#"}]&/@GraphData[{"Sextic","Nonplanar"}]],First][[All,-1]],DividersAll,Alignment{{{Decimal},Left}}]
Out[]=
1 | 7 | {Complete,7} |
2 | 32 | {RegularNonplanarDiameter,{6,2,96}} |
3 | 111 | {RegularNonplanarDiameter,{6,3,111}} |
4 | 390 | {RegularNonplanarDiameter,{6,4,390}} |
5 | 462 | {Odd,6} |
6 | 486 | {Bouwer,{3,6,9}} |
8 | 120 | SmallRhombicosidodecahedralLineGraph |
11 | 924 | {BipartiteKneser,{11,5}} |
∞ | 20 | {NoncayleyTransitive,{20,17}} |
Graphic
Graphic
In[]:=
GraphicsGrid[Partition[Show[GraphData[#]//StyleGraphs,PlotLabelTextCell[Style[GraphData[#,"Name"],Directive[Italic,FontFamily"Times"]],TextAlignmentCenter,PageWidth150]]&/@data[[;;4,-1]],UpTo[3]],ImageSize600]
Out[]=

6-2 K4*X8, Wegner (optimal; 32 vertices) [order-4 LCF known]
6-2 K4*X8, Wegner (optimal; 32 vertices) [order-4 LCF known]
6-3 Exoo (best known; 111 vertices) [no LCF known]—symmetric non-arc-transitve!
6-3 Exoo (best known; 111 vertices) [no LCF known]—symmetric non-arc-transitve!
6-4 Exoo (nonoptimal; 384 vertices) [no LCF known]
6-4 Exoo (nonoptimal; 384 vertices) [no LCF known]
6-4 (best known; 390 vertices) [no LCF known]
6-4 (best known; 390 vertices) [no LCF known]
6-5 Loz_1404 (best known; 1404 vertices)
6-5 Loz_1404 (best known; 1404 vertices)
6-6 H_5(K_4) (best known; 7917 vertices)
6-6 H_5(K_4) (best known; 7917 vertices)
6-7 (best known; 19282 vertices)
6-7 (best known; 19282 vertices)
6-9 (best known; 3313875 vertices)
6-9 (best known; 3313875 vertices)
Septic
Septic
Summary
Summary
Table
Table
In[]:=
TextGrid[data=SplitBy[Sort[GraphData[#,{"Diameter","V","#"}]&/@GraphData[{"Septic","Nonplanar"}]],First][[All,-1]],DividersAll,Alignment{{{Decimal},Left}}]
Out[]=
1 | 8 | {Complete,8} |
2 | 50 | HoffmanSingletonGraph |
3 | 168 | {RegularNonplanarDiameter,{7,3,168}} |
4 | 330 | DoublyTruncatedWittGraph |
5 | 100 | HoffmanSingletonBipartiteDoubleGraph |
6 | 1716 | {Odd,7} |
7 | 128 | {Hypercube,7} |
∞ | 20 | {Circulant,{20,{2,4,8,10}}} |
Graphic
Graphic
In[]:=
GraphicsGrid[Partition[Show[GraphData[#]//StyleGraphs,PlotLabelTextCell[Style[GraphData[#,"Name"],Directive[Italic,FontFamily"Times"]],TextAlignmentCenter,PageWidth150]]&/@data[[;;3,-1]],UpTo[3]],ImageSize600]
Out[]=
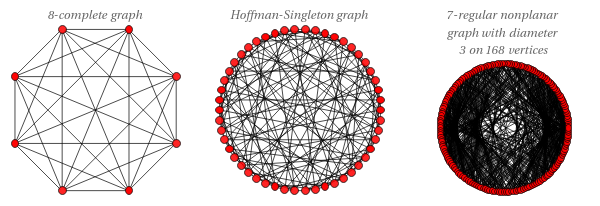
7-2 (optimal; HoffmanSingletonGraph) [order-5 LCF known]
7-2 (optimal; HoffmanSingletonGraph) [order-5 LCF known]
7-3 Exoo (best known; 168 vertices) [no LCF known]
7-3 Exoo (best known; 168 vertices) [no LCF known]
7-4 (best known; 672 vertices)
7-4 (best known; 672 vertices)
7-5 (best known; 2756 vertices)
7-5 (best known; 2756 vertices)
7-6 Exoo (nonoptimal; 11232 vertices)
7-6 Exoo (nonoptimal; 11232 vertices)
7-6 (best known; 11998 vertices)
7-6 (best known; 11998 vertices)
7-7 (best known; 52768 vertices)
7-7 (best known; 52768 vertices)
Octic
Octic
Summary
Summary
Table
Table
In[]:=
TextGrid[data=SplitBy[Sort[GraphData[#,{"Diameter","V","#"}]&/@GraphData[{"Octic","Nonplanar"}]],First][[All,-1]],DividersAll,Alignment{{{Decimal},Left}}]
Out[]=
1 | 9 | {Complete,9} |
2 | 28 | {NoncayleyTransitive,{28,11}} |
3 | 253 | {RegularNonplanarDiameter,{8,3,253}} |
4 | 800 | {Cage,{8,8}} |
5 | 60 | SnubCubicalLineGraph |
6 | 360 | {Arrangement,{6,4}} |
8 | 256 | {Hypercube,8} |
∞ | 20 | Two5CocktailPartyGraphs |
Graphic
Graphic
In[]:=
GraphicsGrid[Partition[Show[GraphData[#]//StyleGraphs,PlotLabelTextCell[Style[GraphData[#,"Name"],Directive[Italic,FontFamily"Times"]],TextAlignmentCenter,PageWidth150]]&/@data[[;;3,-1]],UpTo[3]],ImageSize600]
Out[]=

8-2 (not regular; 57 vertices)
8-2 (not regular; 57 vertices)
8-3 (best known; 253 vertices)
8-3 (best known; 253 vertices)
8-4 (best known; 1110 vertices)
8-4 (best known; 1110 vertices)
8-5 (best known; 5060 vertices)
8-5 (best known; 5060 vertices)
8-6 (best known; 5060 vertices)
8-6 (best known; 5060 vertices)
8-7 (best known; 130017 vertices)
8-7 (best known; 130017 vertices)
9
9
Summary
Summary
Table
Table
In[]:=
TextGrid[data=SplitBy[Sort[GraphData[#,{"Diameter","V","#"}]&/@Select[GraphData[{"Regular","Nonplanar"}],GraphData[#,"MaximumVertexDegree"]===9&]],First][[All,-1]],DividersAll,Alignment{{{Decimal},Left}}]
Out[]=
1 | 10 | {Complete,10} |
2 | 30 | {Circulant,{30,{5,6,10,12,15}}} |
3 | 146 | {Cage,{9,6}} |
4 | 1170 | {Cage,{9,8}} |
9 | 512 | {Hypercube,9} |
∞ | 20 | 2K10 |
Graphic
Graphic
In[]:=
GraphicsGrid[Partition[Show[GraphData[#]//StyleGraphs,PlotLabelTextCell[Style[GraphData[#,"Name"],Directive[Italic,FontFamily"Times"]],TextAlignmentCenter,PageWidth150]]&/@data[[;;2,-1]],UpTo[3]],ImageSize600]
9-4 (best known; 1550 vertices)
9-4 (best known; 1550 vertices)
9-5 (best known; 8268 vertices)
9-5 (best known; 8268 vertices)
9-6 (best known; 75 893 vertices)
9-6 (best known; 75 893 vertices)
9-7 (best known; 270192 vertices)
9-7 (best known; 270192 vertices)
10
10
Summary
Summary
Table
Table
In[]:=
TextGrid[data=SplitBy[Sort[GraphData[#,{"Diameter","V","#"}]&/@Select[GraphData[{"Regular","Nonplanar"}],GraphData[#,"MaximumVertexDegree"]===10&]],First][[All,-1]],DividersAll,Alignment{{{Decimal},Left}}]
Out[]=
1 | 11 | {Complete,11} |
2 | 56 | {Kneser,{8,3}} |
3 | 186 | {GeneralizedHexagon,{5,1}} |
4 | 1640 | {Cage,{10,8}} |
5 | 512 | {FoldedCube,10} |
10 | 1024 | {Hypercube,10} |
Graphic
Graphic
In[]:=
GraphicsGrid[Partition[Show[GraphData[#]//StyleGraphs,PlotLabelTextCell[Style[GraphData[#,"Name"],Directive[Italic,FontFamily"Times"]],TextAlignmentCenter,PageWidth150]]&/@data[[;;2,-1]],UpTo[3]],ImageSize600]
10-4 (best known; 2223 vertices)
10-4 (best known; 2223 vertices)
10-5 (best known; 13140 vertices)
10-5 (best known; 13140 vertices)
10-6 (best known; 134 690 vertices)
10-6 (best known; 134 690 vertices)
10-7 (best known; 561957 vertices)
10-7 (best known; 561957 vertices)
11
11
Summary
Summary
Table
Table
In[]:=
TextGrid[data=SplitBy[Sort[GraphData[#,{"Diameter","V","#"}]&/@Select[GraphData[{"Regular","Nonplanar"}],GraphData[#,"MaximumVertexDegree"]===11&]],First][[All,-1]],DividersAll,Alignment{{{Decimal},Left}}]
Out[]=
1 | 12 | {Complete,12} |
2 | 104 | {RegularNonplanarDiameter,{11,2,104}} |
3 | 46 | {DifferenceSetIncidence,{23,11,5}} |
4 | 266 | LivingstoneGraph |
Graphic
Graphic
In[]:=
GraphicsGrid[Partition[Show[GraphData[#]//StyleGraphs,PlotLabelTextCell[Style[GraphData[#,"Name"],Directive[Italic,FontFamily"Times"]],TextAlignmentCenter,PageWidth150]]&/@data[[;;2,-1]],UpTo[3]],ImageSize600]
Out[]=

11-2 Exoo (best known; 104 vertices)
11-2 Exoo (best known; 104 vertices)
11-5 (best known; 18700 vertices)
11-5 (best known; 18700 vertices)
11-7 (best known; 971028 vertices)
11-7 (best known; 971028 vertices)
12
12
Summary
Summary
Table
Table
In[]:=
TextGrid[data=SplitBy[Sort[GraphData[#,{"Diameter","V","#"}]&/@Select[GraphData[{"Regular","Nonplanar"}],GraphData[#,"MaximumVertexDegree"]===12&]],First][[All,-1]],DividersAll,Alignment{{{Decimal},Left}}]
Out[]=
1 | 13 | {Complete,13} |
2 | 49 | {Rook,{7,7}} |
3 | 208 | PGammaU34OnNonisotropicPoints |
4 | 2928 | {Cage,{12,8}} |
5 | 120 | SixHundredCellGraph |
6 | 729 | {Hamming,{6,3}} |
Graphic
Graphic
In[]:=
GraphicsGrid[Partition[Show[GraphData[#]//StyleGraphs,PlotLabelTextCell[Style[GraphData[#,"Name"],Directive[Italic,FontFamily"Times"]],TextAlignmentCenter,PageWidth150]]&/@data[[;;2,-1]],UpTo[3]],ImageSize600]
12-2 (not regular; 133 vertices)
12-2 (not regular; 133 vertices)
12-5 (best known; 29470 vertices)
12-5 (best known; 29470 vertices)
12-6 (best known; 359 772 vertices)
12-6 (best known; 359 772 vertices)
12-7 (best known; 1900464 vertices)
12-7 (best known; 1900464 vertices)
13
13
Summary
Summary
Table
Table
In[]:=
TextGrid[data=SplitBy[Sort[GraphData[#,{"Diameter","V","#"}]&/@Select[GraphData[{"Regular","Nonplanar"}],GraphData[#,"MaximumVertexDegree"]===13&]],First][[All,-1]],DividersAll,Alignment{{{Decimal},Left}}]
Out[]=
1 | 14 | {Complete,14} |
2 | 56 | {Circulant,{56,{7,8,14,16,21,24,28}}} |
3 | 80 | {DifferenceSetIncidence,{40,13,4}} |
Graphic
Graphic
In[]:=
GraphicsGrid[Partition[Show[GraphData[#]//StyleGraphs,PlotLabelTextCell[Style[GraphData[#,"Name"],Directive[Italic,FontFamily"Times"]],TextAlignmentCenter,PageWidth150]]&/@data[[;;2,-1]],UpTo[3]],ImageSize600]
13-2 (best known; 162 vertices)
13-2 (best known; 162 vertices)
13-5 (best known; 29470 vertices)
13-5 (best known; 29470 vertices)
13-7 (best known; 2901404 vertices)
13-7 (best known; 2901404 vertices)
14
14
Summary
Summary
Table
Table
In[]:=
TextGrid[data=SplitBy[Sort[GraphData[#,{"Diameter","V","#"}]&/@Select[GraphData[{"Regular","Nonplanar"}],GraphData[#,"MaximumVertexDegree"]===14&]],First][[All,-1]],DividersAll,Alignment{{{Decimal},Left}}]
Out[]=
1 | 15 | {Complete,15} |
2 | 64 | {Rook,{8,8}} |
3 | 456 | {GeneralizedHexagon,{7,1}} |
4 | 4760 | {Cage,{14,8}} |
Graphic
Graphic
In[]:=
GraphicsGrid[Partition[Show[GraphData[#]//StyleGraphs,PlotLabelTextCell[Style[GraphData[#,"Name"],Directive[Italic,FontFamily"Times"]],TextAlignmentCenter,PageWidth150]]&/@data[[;;2,-1]],UpTo[3]],ImageSize600]
14-2 (not regular; 183 vertices)
14-2 (not regular; 183 vertices)
14-3 Exoo (best known; 912 vertices)
14-3 Exoo (best known; 912 vertices)
14-5 (best known; 56790 vertices)
14-5 (best known; 56790 vertices)
14-6 (best known; 818 094 vertices)
14-6 (best known; 818 094 vertices)
14-7 (best known; 8079298 vertices)
14-7 (best known; 8079298 vertices)
15
15
Summary
Summary
Table
Table
In[]:=
TextGrid[data=SplitBy[Sort[GraphData[#,{"Diameter","V","#"}]&/@Select[GraphData[{"Regular","Nonplanar"}],GraphData[#,"MaximumVertexDegree"]===15&]],First][[All,-1]],DividersAll,Alignment{{{Decimal},Left}}]
Out[]=
1 | 16 | {Complete,16} |
2 | 72 | {Circulant,{72,{8,9,16,18,24,27,32,36}}} |
3 | 506 | TruncatedWittGraph |
5 | 720 | {Transposition,6} |
Graphic
Graphic
In[]:=
GraphicsGrid[Partition[Show[GraphData[#]//StyleGraphs,PlotLabelTextCell[Style[GraphData[#,"Name"],Directive[Italic,FontFamily"Times"]],TextAlignmentCenter,PageWidth150]]&/@data[[;;2,-1]],UpTo[3]],ImageSize600]
15-2 (not regular; 187 vertices)
15-2 (not regular; 187 vertices)
15-5 (best known; 74298 vertices)
15-5 (best known; 74298 vertices)
15-10 (best known; 4.149.702.144 vertices)
15-10 (best known; 4.149.702.144 vertices)
16
16
Summary
Summary
Table
Table
In[]:=
TextGrid[data=SplitBy[Sort[GraphData[#,{"Diameter","V","#"}]&/@Select[GraphData[{"Regular","Nonplanar"}],GraphData[#,"MaximumVertexDegree"]===16&]],First][[All,-1]],DividersAll,Alignment{{{Decimal},Left}}]
Out[]=
1 | 17 | {Complete,17} |
2 | 198 | {RegularNonplanarDiameter,{16,2,198}} |
3 | 657 | {GeneralizedHexagon,{8,1}} |
4 | 625 | {Hamming,{4,5}} |
5 | 154 | M22BipartiteDoubleGraph |
Graphic
Graphic
In[]:=
GraphicsGrid[Partition[Show[GraphData[#]//StyleGraphs,PlotLabelTextCell[Style[GraphData[#,"Name"],Directive[Italic,FontFamily"Times"]],TextAlignmentCenter,PageWidth150]]&/@data[[;;2,-1]],UpTo[3]],ImageSize600]
Out[]=
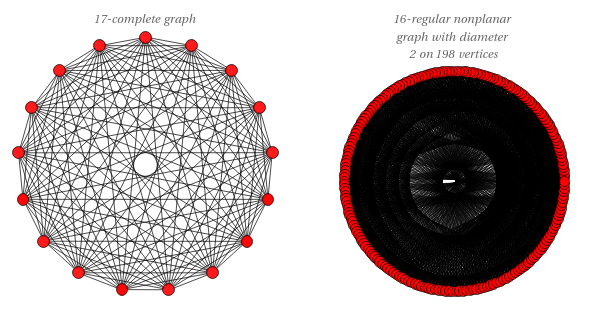
16-2 Exoo (best known; 198 vertices) [no LCF known]
16-2 Exoo (best known; 198 vertices) [no LCF known]
16-10 (best known; 7 394 669 856 vertices)
16-10 (best known; 7 394 669 856 vertices)
Cite this as: Eric W. Weisstein, "Degree Diameter Problem" from the Notebook Archive (2018), https://notebookarchive.org/2019-07-0z3u07e
Download
