Outcomes from Dice
Author
Stephen Wolfram
Title
Outcomes from Dice
Description
Simple Cases
Category
Educational Materials
Keywords
URL
http://www.notebookarchive.org/2019-08-98zxe60/
DOI
https://notebookarchive.org/2019-08-98zxe60
Date Added
2019-08-20
Date Last Modified
2019-08-20
File Size
142.13 kilobytes
Supplements
Rights
Redistribution rights reserved

Outcomes from Dice
Outcomes from Dice
Simple Cases
Simple Cases
Here are possible values for a 6-sided die:
In[]:=
Table[i,{i,6}]
Out[]=
{1,2,3,4,5,6}
These are possible totals for 2 6-sided dice:
In[]:=
Flatten[Table[i+j,{i,6},{j,6}]]
Out[]=
{2,3,4,5,6,7,3,4,5,6,7,8,4,5,6,7,8,9,5,6,7,8,9,10,6,7,8,9,10,11,7,8,9,10,11,12}
Here’s a histogram of the total values:
In[]:=
Histogram[%,{1}]
Out[]=

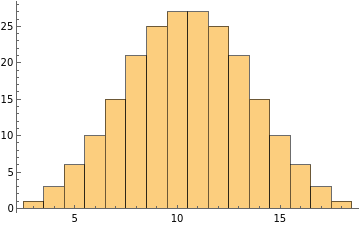
Results for 3 dice:
In[]:=
Flatten[Table[i+j+k,{i,6},{j,6},{k,6}]]
Out[]=
{3,4,5,6,7,8,4,5,6,7,8,9,5,6,7,8,9,10,6,7,8,9,10,11,7,8,9,10,11,12,8,9,10,11,12,13,4,5,6,7,8,9,5,6,7,8,9,10,6,7,8,9,10,11,7,8,9,10,11,12,8,9,10,11,12,13,9,10,11,12,13,14,5,6,7,8,9,10,6,7,8,9,10,11,7,8,9,10,11,12,8,9,10,11,12,13,9,10,11,12,13,14,10,11,12,13,14,15,6,7,8,9,10,11,7,8,9,10,11,12,8,9,10,11,12,13,9,10,11,12,13,14,10,11,12,13,14,15,11,12,13,14,15,16,7,8,9,10,11,12,8,9,10,11,12,13,9,10,11,12,13,14,10,11,12,13,14,15,11,12,13,14,15,16,12,13,14,15,16,17,8,9,10,11,12,13,9,10,11,12,13,14,10,11,12,13,14,15,11,12,13,14,15,16,12,13,14,15,16,17,13,14,15,16,17,18}
Histogram of values for 3 dice:
In[]:=
Histogram[%,{1}]
Out[]=
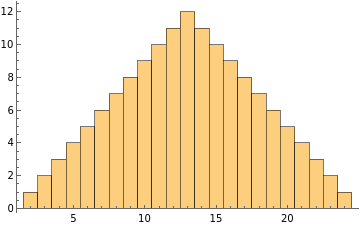
Results for a pair of 12-sided (dodecahedral) dice:
In[]:=
Flatten[Table[i+j,{i,12},{j,12}]]
Out[]=
{2,3,4,5,6,7,8,9,10,11,12,13,3,4,5,6,7,8,9,10,11,12,13,14,4,5,6,7,8,9,10,11,12,13,14,15,5,6,7,8,9,10,11,12,13,14,15,16,6,7,8,9,10,11,12,13,14,15,16,17,7,8,9,10,11,12,13,14,15,16,17,18,8,9,10,11,12,13,14,15,16,17,18,19,9,10,11,12,13,14,15,16,17,18,19,20,10,11,12,13,14,15,16,17,18,19,20,21,11,12,13,14,15,16,17,18,19,20,21,22,12,13,14,15,16,17,18,19,20,21,22,23,13,14,15,16,17,18,19,20,21,22,23,24}
Histogram of the results:
In[]:=
Histogram[%,{1}]
Out[]=
Histogram of values for 3 12-sided dice:
Histogram[Flatten[Table[i+j+k,{i,12},{j,12},{k,12}]],{1}]
Out[]=
The More General Case
The More General Case
A more compact way to compute the same thing:
In[]:=
Histogram[Flatten[Array[Plus,Table[12,3]]],{1}]
Out[]=
Here’s what Array does:
In[]:=
Array[f,5]
Out[]=
{f[1],f[2],f[3],f[4],f[5]}
Here’s the 2-dimensional version:
In[]:=
Array[f,{3,4}]//TableForm
Out[]//TableForm=
f[1,1] | f[1,2] | f[1,3] | f[1,4] |
f[2,1] | f[2,2] | f[2,3] | f[2,4] |
f[3,1] | f[3,2] | f[3,3] | f[3,4] |
And 3-dimensional:
In[]:=
Array[f,{3,4,2}]//TableForm
Out[]//TableForm=
|
|
|
| ||||||||
|
|
|
| ||||||||
|
|
|
|
Here’s applying the function Plus in each case:
In[]:=
Array[Plus,{3,2,4}]
Out[]=
{{{3,4,5,6},{4,5,6,7}},{{4,5,6,7},{5,6,7,8}},{{5,6,7,8},{6,7,8,9}}}
This gives the distribution of totals for 4 12-sided dice:
In[]:=
Histogram[Flatten[Array[Plus,Table[12,4]]],{1}]
Out[]=
And for 5 12-sided dice:
In[]:=
Histogram[Flatten[Array[Plus,Table[12,5]]],{1}]
Out[]=
And 7 12-sided dice:
In[]:=
Histogram[Flatten[Array[Plus,Table[12,7]]],{1}]
Out[]=
This is the total number of configurations of all the dice:
In[]:=
12^7
Out[]=
35831808
Beyond Computing Totals
Beyond Computing Totals
Here are the possible configurations for 2 6-sided dice:
In[]:=
Tuples[Range[6],2]
Out[]=
{{1,1},{1,2},{1,3},{1,4},{1,5},{1,6},{2,1},{2,2},{2,3},{2,4},{2,5},{2,6},{3,1},{3,2},{3,3},{3,4},{3,5},{3,6},{4,1},{4,2},{4,3},{4,4},{4,5},{4,6},{5,1},{5,2},{5,3},{5,4},{5,5},{5,6},{6,1},{6,2},{6,3},{6,4},{6,5},{6,6}}
The result for 4 dice is very long:
In[]:=
Tuples[Range[6],4]//Short
Out[]//Short=
{{1,1,1,1},{1,1,1,2},{1,1,1,3},{1,1,1,4},1288,{6,6,6,3},{6,6,6,4},{6,6,6,5},{6,6,6,6}}
Instead of computing the total of all the dice, let’s compute the minimum value of any die.
This gives the minimum value for any of the dice:
In[]:=
Min/@Tuples[Range[6],4]//Short
Out[]//Short=
{1,1,1,1,1,1,1,1,1,1,1,1,1,1,1,1,1,1,1,1,1256,3,3,1,2,3,4,4,4,1,2,3,4,5,5,1,2,3,4,5,6}
Here’s a historgram:
In[]:=
Histogram[%]
Out[]=

This is the distribution of total - minimum for 4 6-sided dice:
In[]:=
Histogram[Total[#]-Min[#]&/@Tuples[Range[6],4],{1}]
Out[]=

Subtract 10 and divide by 2:
In[]:=
Histogram[(Total[#]-Min[#]-10)/2&/@Tuples[Range[6],4],{1}]
Out[]=

This corresponds to rules for [[XXXXX]].
In[]:=
Histogram[Floor[(Total[#]-Min[#]-10)/2]&/@Tuples[Range[6],4],{1}]
Out[]=

Floors and Ceilings [UNFINISHED]
Floors and Ceilings [UNFINISHED]
In[]:=
Floor[4.3]
Out[]=
4
In[]:=
Ceiling[4.3]
Out[]=
5
In[]:=
Round[4.5]
Out[]=
4
In[]:=
Round[3.5]
Out[]=
4
In[]:=
Round[2.5]
Out[]=
2
In[]:=
Plot[Round[x],{x,0,10}]
Out[]=

Cite this as: Stephen Wolfram, "Outcomes from Dice" from the Notebook Archive (2019), https://notebookarchive.org/2019-08-98zxe60
Download
