Simplified Machine-Learning Workflow #2
Author
Anton Antonov
Title
Simplified Machine-Learning Workflow #2
Description
Quantile Regression (Part 2)
Category
Educational Materials
Keywords
URL
http://www.notebookarchive.org/2020-09-55rqpth/
DOI
https://notebookarchive.org/2020-09-55rqpth
Date Added
2020-09-11
Date Last Modified
2020-09-11
File Size
1.03 megabytes
Supplements
Rights
Redistribution rights reserved

Here is the of this notebook.
recordedvideo
QRMon live coding follow-up
QRMon live coding follow-up
Anton Antonov
September 2019
September 2019
What we talked about last time?
What we talked about last time?
Packages load
Packages load
In[]:=
Import["https://raw.githubusercontent.com/antononcube/MathematicaForPrediction/master/MonadicProgramming/MonadicQuantileRegression.m"]Import["https://raw.githubusercontent.com/antononcube/MathematicaForPrediction/master/MonadicProgramming/MonadicStructuralBreaksFinder.m"]Import["https://raw.githubusercontent.com/antononcube/MathematicaForPrediction/master/MonadicProgramming/MonadicAnomaliesFinder.m"]
In[]:=
Data load
Data load
In[]:=
Distribution data
Distribution data
In[]:=
distData=Tablex,Exp[-x^2]+RandomVariateNormalDistribution0,.15
Abs[1.5-x]/1.5
,{x,-3,3,.01};ListPlot[distData]Out[]=
Temperature data
Temperature data
In[]:=
tsData=WeatherData[{"Orlando","Florida"},"Temperature",{{2015,1,1},{2019,8,30},"Day"}]
Out[]=
TimeSeries
 |
| |||||
In[]:=
TimeSeries
|
| |||||
Out[]=
TimeSeries
|
| |||||
In[]:=
DateListPlot[tsData, AspectRatio1/4,ImageSize700]
Out[]=

Financial data
Financial data
In[]:=
finData1=TimeSeries
["Path"];
 |
| |||||||||||
In[]:=
DateListPlot[finData1]
Out[]=

In[]:=
finData2=FinancialData["GE",{{2015,1,1},{2019,8,30},"Day"}]
Out[]=
TimeSeries
|
| |||||
In[]:=
DateListPlot[finData2]
Out[]=

Data to be cleaned
Data to be cleaned
In[]:=
sampleData={{1387.5,2.665*^7},{1302.5,2.635*^7},{1222.5,2.455*^7},{1182.5,2.385*^7},{1142.5,2.315*^7},{1097.5,2.305*^7},{852.5,2.245*^7},{897.5,2.245*^7},{977.5,2.225*^7},{937.5,2.205*^7},{812.5,2.175*^7},{732.5,1.955*^7},{652.5,1.835*^7},{692.5,1.835*^7},{567.5,1.765*^7},{527.5,1.725*^7},{447.5,1.625*^7},{362.5,1.455*^7},{322.5,1.275*^7},{282.5,1.095*^7},{242.5,9.35*^6},{202.5,7.15*^6},{157.5,4.85*^6},{1017.9003407155026,4.79701873935264*^6},{77.5,1.55*^6}};
Data cleaning (small)
Data cleaning (small)
In[]:=
cleanData=QRMonUnit[sampleData]⟹QRMonQuantileRegression[12,0.5,Method{LinearProgramming,Method"InteriorPoint",Tolerance10^(-3)}]⟹QRMonPlot⟹QRMonErrorPlots["RelativeErrors"False]⟹QRMonPickPathPoints[10^6]⟹QRMonTakeValue;
»
Plot:
 |
|
»
Error plots:0.5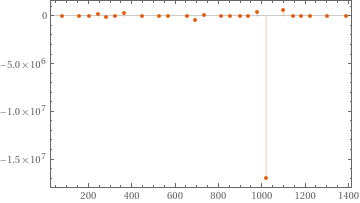
In[]:=
cleanData=First[Values[cleanData]];ListPlot[{sampleData,cleanData},PlotStyle{{PointSize[0.03],Pink},Blue},PlotLegends{"sampleData","clean data"},PlotRangeAll,PlotTheme"Scientific"]
Out[]=
 |
|
Identifying anomalies by residuals outliers
Identifying anomalies by residuals outliers
In[]:=
finData=finData1;
Using Thresholds
Using Thresholds
In[]:=
qrObj2=QRMonUnit[finData]⟹QRMonQuantileRegression[100,0.5]⟹QRMonPlot⟹QRMonErrorPlots["RelativeErrors"False]⟹QRMonFindAnomaliesByResiduals["Threshold"2];
»
Plot:
 |
|
»
Error plots:0.5
In[]:=
qrObj2⟹QRMonTakeValue
Out[]=
{{3583612800,33.305},{3600374400,34.485},{3630960000,44.11},{3638822400,51.84},{3648844800,57.83},{3648931200,57.59},{3649104000,52.84},{3649363200,50.34},{3649449600,51.09},{3652473600,55.72},{3656361600,59.74},{3663014400,60.77},{3663273600,61.4},{3663360000,60.695},{3663619200,54.49},{3663878400,54.14},{3663964800,54.42},{3664051200,55.14},{3664137600,54.92},{3666470400,57.07},{3675974400,53.69},{3692044800,55.52},{3692390400,55.35},{3692476800,55.99},{3694291200,58.7},{3694377600,58.46},{3694896000,53.9},{3694982400,53.87},{3705350400,64.57},{3710102400,59.5},{3710188800,54.},{3719088000,57.91},{3720729600,55.91},{3725568000,61.41},{3725654400,61.69},{3725740800,60.83},{3725827200,60.55}}
In[]:=
ListPlot[{finData,qrObj2⟹QRMonTakeValue}]
Out[]=
Using Outlier Identifiers
Using Outlier Identifiers
In[]:=
RecordsSummary[finData]
Out[]=
,
1 column 1 | ||||||||||||
|
2 column 2 | ||||||||||||
|
In[]:=
OutlierIdentifier[finData〚All,2〛,BottomOutliers@*HampelIdentifierParameters]
In[]:=
qrObj2=QRMonUnit[finData]⟹QRMonQuantileRegression[120,0.5]⟹QRMonSetRegressionFunctionsPlotOptions[{PlotStyleRed}]⟹QRMonPlot[AspectRatio1/4,ImageSizeLarge]⟹QRMonErrorPlots["RelativeErrors"False,AspectRatio1/4,ImageSizeLarge]⟹QRMonFindAnomaliesByResiduals["OutlierIdentifier"SPLUSQuartileIdentifierParameters];
»
Plot:
 | |||
|
»
Error plots:0.5
In[]:=
DateListPlot[{finData,(qrObj2⟹QRMonTakeValue)},AspectRatio1/4,Joined{True,False},ImageSizeLarge]
Out[]=

Comparison with AnomalyDetection
Comparison with AnomalyDetection
Partition the time-value pairs to a list of consecutive windows:
In[]:=
pdata=Partition[finData,4,3];
Attempt to find anomalous events and visualize them:
In[]:=
anomlies=FindAnomalies[pdata,AcceptanceThreshold0.002];p1=DateListPlot[finData,AspectRatio1/4];p2=ListPlot[Flatten[anomlies,1],PlotStyle{PointSize[0.005`],Opacity[0.5`],Red}];
In[]:=
Show[{p1,p2},ImageSize1200]
Out[]=

Identifying anomalies by contextual outliers
Identifying anomalies by contextual outliers
In[]:=
RecordsSummary[tsData["Path"],{"regressor","value"}]
Out[]=
,
1 regressor | ||||||||||||
|
2 value | ||||||||||||||
|
In[]:=
tsData
Out[]=
TimeSeries
|
| |||||
In[]:=
RecordsSummary[QRMonUnit[tsData]⟹QRMonTakeData[],{"time","temp"}]
Out[]=
,
1 time | ||||||||||||
|
2 temp | ||||||||||||
|
In[]:=
qrObj3=QRMonUnit[tsData]⟹QRMonEchoDataSummary⟹QRMonQuantileRegression[12,{0.02,0.98}]⟹QRMonDateListPlot[ImageSizeLarge,PlotTheme->"Detailed"]⟹QRMonOutliersPlot[ImageSizeLarge,"DateListPlot"True];
»
Data summary:
,
1 column 1 | ||||||||||||
|
2 column 2 | ||||||||||||
|
»
Plot:
 |
|
»
Outliers plot:
In[]:=
qrObj3⟹QRMonTakeValue
Out[]=

In[]:=
Keys[qrObj3⟹QRMonTakeContext]
Out[]=
{data,regressionFunctions,outliers,outlierRegressionFunctions}
In[]:=
qrObj3⟹QRMonTakeOutliers
Out[]=
bottomOutliers{{3.63338×,7.67},{3.63666×,12.44},{3.64228×,21.22},{3.64383×,18.06},{3.64513×,23.33},{3.65731×,14.33},{3.66155×,8.39},{3.66224×,7.44},{3.66258×,6.22},{3.66267×,6.33},{3.66414×,7.39},{3.67796×,25.28},{3.67822×,25.28},{3.67839×,25.39},{3.67934×,24.94},{3.69282×,6.61},{3.69291×,5.89},{3.69472×,10.},{3.69852×,12.78},{3.69861×,10.},{3.6987×,10.},{3.72185×,8.78},{3.72194×,9.94},{3.72401×,5.28},{3.7241×,6.44},{3.72419×,8.5},{3.72522×,7.11},{3.72531×,4.72},{3.72954×,11.22},{3.72963×,10.94},{3.73291×,16.39},{3.7374×,22.5},{3.75235×,9.},{3.75356×,8.11},{3.75702×,7.67},{3.7571×,8.11},{3.75788×,7.22},{3.76082×,11.17},{3.76911×,22.61},{3.77196×,23.17},{3.77274×,24.22},{3.77309×,24.11}},topOutliers{{3.62932×,23.83},{3.6345×,24.61},{3.63511×,25.39},{3.639×,27.83},{3.64833×,29.39},{3.64945×,29.78},{3.65049×,28.89},{3.65083×,31.17},{3.66025×,24.67},{3.66811×,26.28},{3.66846×,27.11},{3.66854×,27.22},{3.67675×,31.},{3.67865×,30.5},{3.68997×,24.67},{3.69239×,24.39},{3.70025×,26.67},{3.70043×,26.11},{3.70993×,30.},{3.71002×,30.89},{3.71641×,28.44},{3.71667×,28.28},{3.72738×,24.44},{3.72868×,24.89},{3.72885×,24.06},{3.73196×,26.78},{3.73689×,28.17},{3.74579×,29.39},{3.74596×,29.33},{3.74613×,29.5},{3.7482×,28.72},{3.75987×,25.5},{3.75996×,25.78},{3.76419×,26.33},{3.76834×,29.56},{3.7686×,29.28},{3.77568×,29.11}}
9
10
9
10
9
10
9
10
9
10
9
10
9
10
9
10
9
10
9
10
9
10
9
10
9
10
9
10
9
10
9
10
9
10
9
10
9
10
9
10
9
10
9
10
9
10
9
10
9
10
9
10
9
10
9
10
9
10
9
10
9
10
9
10
9
10
9
10
9
10
9
10
9
10
9
10
9
10
9
10
9
10
9
10
9
10
9
10
9
10
9
10
9
10
9
10
9
10
9
10
9
10
9
10
9
10
9
10
9
10
9
10
9
10
9
10
9
10
9
10
9
10
9
10
9
10
9
10
9
10
9
10
9
10
9
10
9
10
9
10
9
10
9
10
9
10
9
10
9
10
9
10
9
10
9
10
9
10
Structural breaks
Structural breaks
In[]:=
qrObj4=QRMonUnit[finData]⟹QRMonEchoDataSummary⟹QRMonDateListPlot[PlotTheme"Detailed",ImageSizeLarge];
»
Data summary:
,
1 column 1 | ||||||||||||
|
2 column 2 | ||||||||||||
|
»
Plot:
In[]:=
gr1=qrObj4⟹QRMonTakeValue;
In[]:=
stPoints=qrObj4⟹QRMonFindChowTestLocalMaxima["Knots"20,InterpolationOrder2,"NearestWithOutliers"False,"NumberOfProximityPoints"5,"DateListPlot"True,"EchoPlots"True]⟹QRMonEchoValue⟹QRMonTakeValue;
»
Plot:
 |
|
»

»
value:{{3592857600,141.909},{3641673600,3154.41},{3669926400,1813.03}}
In[]:=
DateListPlot[finData,GridLines{stPoints〚All,1〛},ImageSizeLarge]
Out[]=

In[]:=
gr1=QRMonUnit[Select[finData,#〚1〛≤stPoints〚2,1〛&]]⟹QRMonFit[{1,x}]⟹QRMonDateListPlot[ImageSizeLarge,PlotRange{MinMax[finData〚All,1〛],MinMax[finData〚All,2〛]}]⟹QRMonTakeValue;
»
Plot:
 |
|
In[]:=
gr2=QRMonUnit[Select[finData,#〚1〛>=stPoints〚2,1〛&]]⟹QRMonFit[{1,x}]⟹QRMonDateListPlot[ImageSizeLarge]⟹QRMonTakeValue;
»
Plot:
 |
|
In[]:=
Show[{gr1,gr2}]
Out[]=
 |
|
Local extrema in noisy data
Local extrema in noisy data
In[]:=
qFuncs=qrObj5⟹QRMonTakeRegressionFunctions;
In[]:=
Map[Simplify[#[x]]&,qFuncs]
Out[]=
0.5
|
In[]:=
qrObj5=QRMonUnit[tsData]⟹QRMonQuantileRegression[12,0.5]⟹QRMonDateListPlot[ImageSizeLarge]⟹QRMonFindLocalExtrema["NearestWithOutliers"False,"NumberOfProximityPoints"300]⟹QRMonEchoValue;
»
Plot:
 |
|
»
value:localMinima{{3.66258×,6.22},{3.69291×,5.89},{3.72531×,4.72},{3.75788×,7.22}},localMaxima{{3.65083×,31.17},{3.67675×,31.},{3.71002×,30.89},{3.74077×,29.56},{3.76834×,29.56}}
9
10
9
10
9
10
9
10
9
10
9
10
9
10
9
10
9
10
In[]:=
Show[{DateListPlot[{tsData},JoinedFalse,PlotStyleGray],ListPlot[Values[qrObj5⟹QRMonTakeValue]]}]
Out[]=

References
References
[1] Anton Antonov, "A monad for Quantile Regression workflows", (2018), MathematicaForPrediction at WordPress.
[2] Anton Antonov, "Finding all structural breaks in time series", (2019), MathematicaForPrediction at WordPress.
Cite this as: Anton Antonov, "Simplified Machine-Learning Workflow #2" from the Notebook Archive (2020), https://notebookarchive.org/2020-09-55rqpth
Download
