Mesoscopic Theoretical Modeling and Experimental Study of Rheological Behavior of Water-Based Drilling Fluid Containing Associative Synthetic Polymer, Bentonite, and Limestone
Author
Ali Kariman Moghaddam
Title
Mesoscopic Theoretical Modeling and Experimental Study of Rheological Behavior of Water-Based Drilling Fluid Containing Associative Synthetic Polymer, Bentonite, and Limestone
Description
This code evaluates the viscosity change of complex fluids as described in the article https://doi.org/10.1016/j.molliq.2021.117950.
Category
Academic Articles & Supplements
Keywords
URL
http://www.notebookarchive.org/2022-02-4m7rhk8/
DOI
https://notebookarchive.org/2022-02-4m7rhk8
Date Added
2022-02-10
Date Last Modified
2022-02-10
File Size
0.88 megabytes
Supplements
Rights
Redistribution rights reserved

This file contains supplementary data for Ali Kariman Moghaddam, Shadfar Davoodi, Ahmad Ramazani S.A. and Konstantin M. Minaev, “Mesoscopic theoretical modeling and experimental study of rheological behavior of water-based drilling fluid containing associative synthetic polymer, bentonite, and limestone,” Journal of Molecular Liquids, 347, 2022 117950. https://doi.org/10.1016/j.molliq.2021.117950.
Mesoscopic Theoretical Modeling and Experimental Study of Rheological Behavior of Water-Based Drilling Fluid Containing Associative Synthetic Polymer, Bentonite, and Limestone
Mesoscopic Theoretical Modeling and Experimental Study of Rheological Behavior of Water-Based Drilling Fluid Containing Associative Synthetic Polymer, Bentonite, and Limestone
Ali Kariman Moghaddam
(***************************************************Example********************************************************************************)b=1*10^-2;landaP=4*10^1;np=1*10^20;l=5.2*10^-9;d=293*10^-9;landaA=2.7*10^-4;phiA=0.2;Aaa=0.35*10^0;beta=12;phiS=0.05;CcS=5*10^-10;rs=2.97*10^-6;kb=1.38*10^-23;T=400;mu=.0015;gamadot=0.010000000;Rheology8[b,landaP,np,l,d,landaA,phiA,kb,T,gamadot,mu,phiS,CcS,rs,Aaa,beta];
b=1*10^-2;landaP=8*10^1;np=2*10^20;l=5.2*10^-9;d=293*10^-9;landaA=2.7*10^-4;phiA=0.4;Aaa=0.35*10^0;beta=12;phiS=0.05;CcS=5*10^-10;rs=2.97*10^-6;kb=1.38*10^-23;T=400;mu=.0015;Rheology8[b,landaP,np,l,d,landaA,phiA,kb,T,gamadot,mu,phiS,CcS,rs,Aaa,beta];metass=steadystateplot[b,landaP,np,l,d,landaA,phiA,kb,T,mu,phiS,CcS,rs,Aaa,beta][[1]];msiy1ss=steadystateplot[b,landaP,np,l,d,landaA,phiA,kb,T,mu,phiS,CcS,rs,Aaa,beta][[3]];(*msiy2ss=steadystateplot[b,landaP,np,l,d,landaA,phiA,kb,T,mu,phiS,CcS,rs][[4]];*)metapss=steadystateplot[b,landaP,np,l,d,landaA,phiA,kb,T,mu,phiS,CcS,rs,Aaa,beta][[5]];msiy1pss=steadystateplot[b,landaP,np,l,d,landaA,phiA,kb,T,mu,phiS,CcS,rs,Aaa,beta][[6]];(*msiy2pss=steadystateplot[b,landaP,np,l,d,landaA,phiA,kb,T,mu,phiS,CcS,rs][[7]];*)metaass=steadystateplot[b,landaP,np,l,d,landaA,phiA,kb,T,mu,phiS,CcS,rs,Aaa,beta][[8]];msiy1ass=steadystateplot[b,landaP,np,l,d,landaA,phiA,kb,T,mu,phiS,CcS,rs,Aaa,beta][[9]];(*msiy2ass=steadystateplot[b,landaP,np,l,d,landaA,phiA,kb,T,mu,phiS,CcS,rs][[10]];*)metaSss=steadystateplot[b,landaP,np,l,d,landaA,phiA,kb,T,mu,phiS,CcS,rs,Aaa,beta][[11]];msiy1Sss=steadystateplot[b,landaP,np,l,d,landaA,phiA,kb,T,mu,phiS,CcS,rs,Aaa,beta][[12]];(*msiy2Sss=steadystateplot[b,landaP,np,l,d,landaA,phiA,kb,T,mu,phiS,CcS,rs][[13]];*)
getasscomp=ListLogLogPlot[{metass,metapss,metaass,metaSss,data12LS2Poly},Joined{True,True,True,True,False},InterpolationOrder4,PlotRangeAll,PlotLegendslegend3,FrameTrue,FrameStyleDirective[Black,Larger],FrameLabel{[""],η[Pa.s]},PlotMarkers{"","","","",{"▼",16}},PlotStyle{Directive[Green,Line],Directive[Blue,Dashing[{0.025,.05-0.025}]],Directive[Red,Dashing[{0.03,.05-0.03}]],Directive[Orange,Dashing[{0.04,.05-0.04}]]},ImageSize600]gsiy1sscomp=ListLogLogPlot[{msiy1ss,msiy1pss,msiy1ass,msiy1Sss},JoinedTrue,InterpolationOrder4,PlotRangeAll,PlotLegendslegend4,FrameTrue,FrameStyleDirective[Black,Larger],FrameLabel{[""],[Pa.]},PlotStyle{Directive[Green,Line],Directive[Blue,Dashing[{0.025,.05-0.025}]],Directive[Red,Dashing[{0.03,.05-0.03}]],Directive[Orange,Dashing[{0.04,.05-0.04}]]},ImageSize600]
γ
-1
s
γ
-1
s
ψ
1
2
s
 |
|

 |
|
legend3=LineLegend{Green,Green,{Blue,Dashing[{0.025,.05-0.025}]},{Red,Dashing[{0.03,.05-0.03}]},{Orange,Dashing[{0.04,.05-0.04}]}},"Total Shear Viscosity () -Exp.","Total Shear Viscosity ()- Model \n(=0.921)","Polymer Contribution ()- Model","Bentonite Contribution()- Model","Limestone Contribution()- Model",LegendMarkers{{"▼",16},"","","",""},Joined{False,True,True,True,True},LegendFunction(Framed[#,RoundingRadius5,ImageSize325]&),LegendMargins15
η
Total
η
Total
2
R
η
Polymer
η
Bentonite
η
Limestone
|
legend4=LineLegend[{Green,{Blue,Dashing[{0.025,.05-0.025}]},{Red,Dashing[{0.03,.05-0.03}]},{Orange,Dashing[{0.04,.05-0.04}]}},"1st Normal Stress Coeff. ()- Model","Polymer Contribution ()- Model","Bentonite Contribution ()- Model","Limestone Contribution()-Model",LegendMarkers{"","","",""},Joined{True,True,True,True},LegendFunction(Framed[#,RoundingRadius5,ImageSize325]&),LegendMargins11]
ψ
1-Total
ψ
1-Polymer
ψ
1-Bentonite
ψ
1-Limestone
|
data0LS={{1020,0.006617647},{510,0.011078431},{170,0.025294118},{102,0.039705882},{51,0.073529412},{10.2,0.348039216},{5.1,0.696078431}};data6LS={{1020,0.007598039},{510,0.012254902},{170,0.029411765},{102,0.043137255},{51,0.078431373},{10.2,0.37254902},{5.1,0.725490196}};data12LS={{1020,0.00877451},{510,0.013823529},{170,0.031176471},{102,0.046568627},{51,0.082352941},{10.2,0.37745098},{5.1,0.735294118}};data18LS={{1020,0.009901961},{510,0.015588235},{170,0.037941176},{102,0.055882353},{51,0.093137255},{10.2,0.387254902},{5.1,0.764705882}};
b=1*10^-2;landaP=1*10^3;np=.9*10^1;l=0.6*10^-8;d=6*10^-8;landaA=0.8*10^-1;phiA=.18;Aaa=10;beta=35;phiS=0.01;CcS=10^-7;rs=100*10^-6;kb=1.38*10^-23;T=400;mu=.001;metassdt=steadystateplot[b,landaP,np,l,d,landaA,phiA,kb,T,mu,phiS,CcS,rs,Aaa,beta][[1]];metapssdt=steadystateplot[b,landaP,np,l,d,landaA,phiA,kb,T,mu,phiS,CcS,rs,Aaa,beta][[5]];metaassdt=steadystateplot[b,landaP,np,l,d,landaA,phiA,kb,T,mu,phiS,CcS,rs,Aaa,beta][[8]];metaSssdt=steadystateplot[b,landaP,np,l,d,landaA,phiA,kb,T,mu,phiS,CcS,rs,Aaa,beta][[11]];getass=ListLogLogPlot{metassdt,data0LS,metaassdt,metaassdt,metaSssdt},Joined{True,False,True,True,True},InterpolationOrder4,PlotRangeAll,PlotLegends{"","","","",""},FrameTrue,FrameLabel{[""],η[Pa.s]}
η
Total
η
DT
η
Poly
η
BT
η
SP
γ
-1
s
 |
|
b=1*10^-2;landaP=1*10^3;np=.9*10^1;l=5.5*10^-9;d=293*10^-9;landaA=2.7*10^-4;phiA=0.4;Aaa=0.35*10^0;beta=8;phiS=0.15;CcS=5*10^-10;rs=2.87*10^-6;kb=1.38*10^-23;T=400;mu=.0015;metassdt=steadystateplot[b,landaP,np,l,d,landaA,phiA,kb,T,mu,phiS,CcS,rs,Aaa,beta][[1]];(*metapssdt=steadystateplot[b,landaP,np,l,d,landaA,phiA,kb,T,mu,phiS,CcS,rs,Aaa,beta][[5]];*)metaassdt=steadystateplot[b,landaP,np,l,d,landaA,phiA,kb,T,mu,phiS,CcS,rs,Aaa,beta][[8]];metaSssdt=steadystateplot[b,landaP,np,l,d,landaA,phiA,kb,T,mu,phiS,CcS,rs,Aaa,beta][[11]];getass=ListLogLogPlot{metassdt,data0LS,metaassdt,metaassdt,metaSssdt},Joined{True,False,True,True,True},InterpolationOrder4,PlotLabels{R1,"",R2,R3},PlotRangeAll,PlotLegends{"","","","",""},FrameTrue,FrameLabel{[""],η[Pa.s]}
η
Total
η
DT
η
Poly
η
BT
η
SP
γ
-1
s
 |
|
b=1*10^-2;landaP=8*10^1;np=.9*10^1;l=5.2*10^-9;d=293*10^-9;landaA=2.7*10^-4;phiA=0.4;Aaa=0.35*10^0;beta=12;phiS=0.025;CcS=5*10^-10;rs=2.97*10^-6;kb=1.38*10^-23;T=400;mu=.0015;metassdt0=steadystateplot[b,landaP,np,l,d,landaA,phiA,kb,T,mu,0,CcS,rs,Aaa,beta][[1]];metassdt6=steadystateplot[b,landaP,np,l,d,landaA,phiA,kb,T,mu,0.025,CcS,rs,Aaa,beta][[1]];metassdt12=steadystateplot[b,landaP,np,l,d,landaA,phiA,kb,T,mu,0.05,CcS,rs,Aaa,beta][[1]];metassdt18=steadystateplot[b,landaP,np,l,d,landaA,phiA,kb,T,mu,0.075,CcS,rs,Aaa,beta][[1]];metapssdt=steadystateplot[b,landaP,np,l,d,landaA,phiA,kb,T,mu,phiS,CcS,rs,Aaa,beta][[5]];metaassdt=steadystateplot[b,landaP,np,l,d,landaA,phiA,kb,T,mu,phiS,CcS,rs,Aaa,beta][[8]];metaSssdt=steadystateplot[b,landaP,np,l,d,landaA,phiA,kb,T,mu,phiS,CcS,rs,Aaa,beta][[11]];getass=ListLogLogPlot[{metassdt0,metassdt6,metassdt12,metassdt18,data0LS,data6LS,data12LS,data18LS},Joined{True,True,True,True,False,False,False,False},InterpolationOrder4,PlotRangeAll,PlotLegendslegend0,FrameTrue,FrameStyleDirective[Black],FrameLabel{[""],η[Pa.s]},PlotMarkers{"","","","",{"",16},{"●",12},{"▼",16},{"▲",16}},PlotStyle{Directive[Blue,Dashing[{0.025,.05-0.025}]],Directive[Red,Dashing[{0.03,.05-0.03}]],Directive[Green,Dashing[{0.04,.05-0.04}]],Directive[Orange,Dashing[{0.045,.05-0.045}]]},ImageSize600,LabelStyleDirective[Black,Larger]]
γ
-1
s
 |
|
Export["LimeEffect.png",getass]
LimeEffect.png
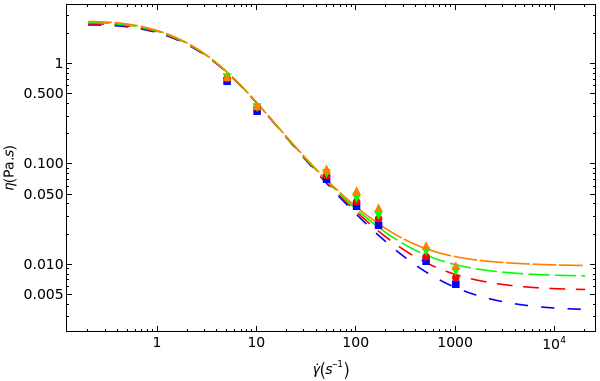
legend0=LineLegend[{{Blue,Dashing[{0.025,.05-0.025}]},{Red,Dashing[{0.03,.05-0.03}]},{Green,Dashing[{0.04,.05-0.04}]},{Orange,Dashing[{0.045,.05-0.045}]},Blue,Red,Green,Orange},{"BT (DF3)- Model (=0.967)","BT+6w% Lim (DF4)- Model (=0.973)","BT+12w% Lim (BF)- Model (=0.979)","BT+18w% Lim (DF5)-Model(=0.981)","BT (DF3)- Exp.","BT+6w% Lim (DF4)- Exp.","BT+12w% Lim (BF)- Exp.","BT+18w% Lim (DF5)- Exp."},LegendMarkers{"","","","",{"",16},{"●",12},{"▼",16},{"▲",16}},Joined{True,True,True,True,False,False,False,False},LegendFunction(Framed[#,RoundingRadius5,ImageSize325]&),LegendMargins15]legend1=LineLegend[{{Blue,Dashing[{0.025,.05-0.025}]},{Red,Dashing[{0.03,.05-0.03}]},{Green,Dashing[{0.04,.05-0.04}]},Blue,Red,Green},{"BT+12w% Lim (BF) \n Model (=0.979)","BT+12w% Lim+0.1w% Ply (DF1) \n Model (=0.962)","BT+12w% Lim+0.2w% Ply (DF2) \n Model (=0.921)","BT+12w% Lim (BF)- Exp.","BT+12w% Lim+0.1w% Ply(DF1)- Exp.","BT+12w% Lim+0.2w% Ply (DF2)- Exp."},LegendMarkers{"","","",{"",16},{"●",12},{"▼",16}},Joined{True,True,True,False,False,False},LegendFunction(Framed[#,RoundingRadius5,ImageSize325]&),LegendMargins15]
2
R
2
R
2
R
2
R
2
R
2
R
2
R
|
|
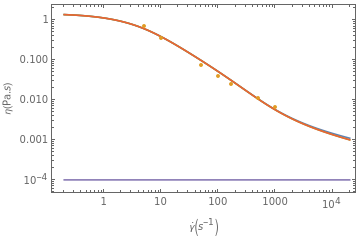
Needs["ErrorBarPlots`"]data12LS0Poly={{1020,0.00877451},{510,0.013823529},{170,0.031176471},{102,0.046568627},{51,0.082352941},{10.2,0.37745098},{5.1,0.666666667}};data12LS1Poly={{1020,0.028431373},{510,0.048039216},{170,0.102941176},{102,0.147058824},{51,0.235294118},{10.2,0.735294118},{5.1,1.176470588}};data12LS2Poly={{1020,0.040196078},{510,0.067647059},{170,0.167941176},{102,0.246568627},{51,0.37254902},{10.2,0.980392157},{5.1,1.568627451}};data12LS0Polye={{{1020,0.00877451},ErrorBar[0.01]},{{510,0.013823529},ErrorBar[0.01]},{{170,0.031176471},ErrorBar[0.01]},{{102,0.046568627},ErrorBar[0.01]},{{51,0.082352941},ErrorBar[0.01]},{{10.2,0.37745098},ErrorBar[0.01]},{{5.1,0.666666667},ErrorBar[0.01]}};gg=ErrorListPlot[data12LS0Polye]
b=1*10^-2;landaP=8*10^1;np=.9*10^1;l=5.2*10^-9;d=293*10^-9;landaA=2.7*10^-4;phiA=0.4;Aaa=0.35*10^0;beta=12;phiS=0.05;CcS=5*10^-10;rs=2.97*10^-6;kb=1.38*10^-23;T=400;mu=.0015;metassdt0=steadystateplot[b,landaP,np,l,d,landaA,phiA,kb,T,mu,phiS,CcS,rs,Aaa,beta][[1]];metassdt1Poly=steadystateplot[b,landaP,1*10^20,l,d,landaA,phiA,kb,T,mu,phiS,CcS,rs,Aaa,beta][[1]];metassdt2Poly=steadystateplot[b,landaP,2*10^20,l,d,landaA,phiA,kb,T,mu,phiS,CcS,rs,Aaa,beta][[1]];getass2=ListLogLogPlot[{metassdt0,metassdt1Poly,metassdt2Poly,data12LS0Poly,data12LS1Poly,data12LS2Poly},Joined{True,True,True,False,False,False},InterpolationOrder4,PlotRangeAll,PlotLegendslegend1,FrameTrue,FrameStyleDirective[Black],FrameLabel{[""],η[Pa.s]},PlotMarkers{"","","",{"",16},{"●",12},{"▼",16}},PlotStyle{Directive[Blue,Dashing[{0.025,.05-0.025}]],Directive[Red,Dashing[{0.03,.05-0.03}]],Directive[Green,Dashing[{0.04,.05-0.04}]]},ImageSize600,LabelStyleDirective[Black,Larger]]
γ
-1
s
 |
|
Export["PolyEffect.png",getass2]
PolyEffect.png
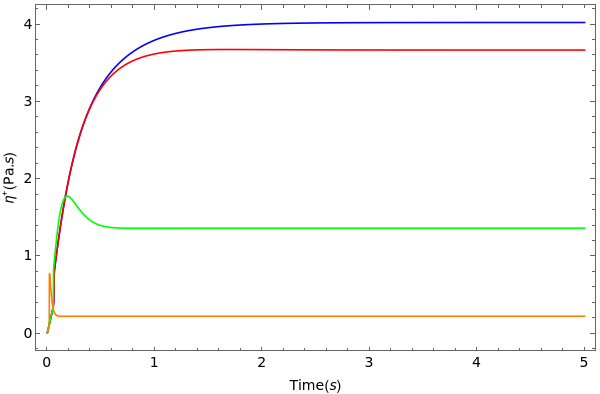
b=1*10^-2;landaP=8*10^1;np=2*10^20;l=5.2*10^-9;d=293*10^-9;landaA=2.7*10^-4;phiA=0.4;Aaa=0.35*10^0;beta=12;phiS=0.05;CcS=5*10^-10;rs=2.97*10^-6;kb=1.38*10^-23;T=400;mu=.0015;gama1=Rheology8[b,landaP,np,l,d,landaA,phiA,kb,T,.1,mu,phiS,CcS,rs,Aaa,beta][[5]];gama2=Rheology8[b,landaP,np,l,d,landaA,phiA,kb,T,1,mu,phiS,CcS,rs,Aaa,beta][[5]];gama3=Rheology8[b,landaP,np,l,d,landaA,phiA,kb,T,10,mu,phiS,CcS,rs,Aaa,beta][[5]];gama4=Rheology8[b,landaP,np,l,d,landaA,phiA,kb,T,100,mu,phiS,CcS,rs,Aaa,beta][[5]];gama5=Rheology8[b,landaP,np,l,d,landaA,phiA,kb,T,1000,mu,phiS,CcS,rs,Aaa,beta][[5]];gama1s=Rheology8[b,landaP,np,l,d,landaA,phiA,kb,T,.1,mu,phiS,CcS,rs,Aaa,beta][[6]];gama2s=Rheology8[b,landaP,np,l,d,landaA,phiA,kb,T,1,mu,phiS,CcS,rs,Aaa,beta][[6]];gama3s=Rheology8[b,landaP,np,l,d,landaA,phiA,kb,T,10,mu,phiS,CcS,rs,Aaa,beta][[6]];gama4s=Rheology8[b,landaP,np,l,d,landaA,phiA,kb,T,100,mu,phiS,CcS,rs,Aaa,beta][[6]];gama5s=Rheology8[b,landaP,np,l,d,landaA,phiA,kb,T,1000,mu,phiS,CcS,rs,Aaa,beta][[6]];
g1vis=Plot[Evaluate[{gama1,gama2,gama3,gama4}],{t,0,5},PlotRangeAll,Frame{True,True,True,True},FrameLabel{Time[s],[Pa.s]},LabelStyleDirective[Black,Larger],PlotStyle{Directive[Blue,Line],Directive[Red,Line],Directive[Green,Line],Directive[Orange,Line],Directive[Purple,Line]},PlotLegendslegend2,ImageSize600]
+
η
 |
|
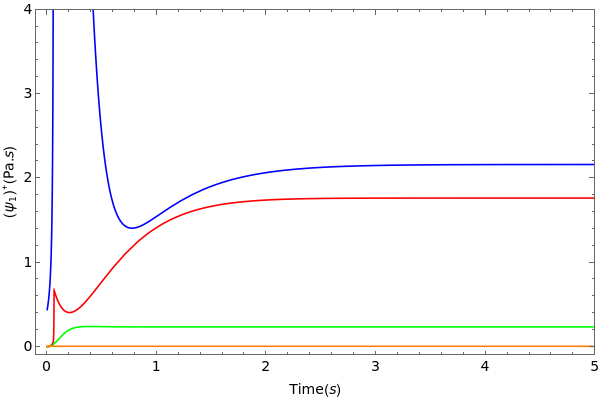
g1siy1=Plot[Evaluate[{gama1s,gama2s,gama3s,gama4s}],{t,0,5},PlotRange{{-0.1,5},{-0.1,4}},FrameTrue,FrameLabel{Time[s],[Pa.s]},LabelStyleDirective[Black,Larger],PlotStyle{Directive[Blue,Line],Directive[Red,Line],Directive[Green,Line],Directive[Orange,Line],Directive[Purple,Line]},PlotLegendslegend2,ImageSize600]
+
ψ
1
 |
|
legend2=LineLegend[{Blue,Red,Green,Orange},{"Shear Rate ()=0.1 - Model","Shear Rate ()=1.0 - Model","Shear Rate ()=10.0 - Model","Shear Rate ()=100 - Model"},LegendMarkers{"","","",""},Joined{True,True,True,True},LegendFunction(Framed[#,RoundingRadius5,ImageSize300]&),LegendMargins15]
γ
-1
s
γ
-1
s
γ
-1
s
γ
-1
s
|
Export["VisContribution.png",getasscomp];Export["SiyContribution.png",gsiy1sscomp];Export["VisTransition.png",g1vis];Export["SiyTransition.png",g1siy1];
v1=1.15;v2=0.85;Erreta[1]=0.5*Sqrt[(steadystateplot[b,landaP,np,l,d,landaA,phiA,kb,T,mu,phiS,CcS,rs*v1,Aaa,beta][[1]]-steadystateplot[b,landaP,np,l,d,landaA,phiA,kb,T,mu,phiS,CcS,rs*v2,Aaa,beta][[1]])^2+(steadystateplot[b,landaP,np,l*v1,d,landaA,phiA,kb,T,mu,phiS,CcS,rs,Aaa,beta][[1]]-steadystateplot[b,landaP,np,l*v2,d,landaA,phiA,kb,T,mu,phiS,CcS,rs,Aaa,beta][[1]])^2+(steadystateplot[b,landaP,np,l,d*v1,landaA,phiA,kb,T,mu,phiS,CcS,rs,Aaa,beta][[1]]-steadystateplot[b,landaP,np,l,d*v2,landaA,phiA,kb,T,mu,phiS,CcS,rs,Aaa,beta][[1]])^2+(steadystateplot[b,landaP,np,l,d,landaA,phiA*v1,kb,T,mu,phiS,CcS,rs,Aaa,beta][[1]]-steadystateplot[b,landaP,np,l,d,landaA,phiA*v2,kb,T,mu,phiS,CcS,rs,Aaa,beta][[1]])^2+(steadystateplot[b,landaP,np,l,d,landaA*v1,phiA,kb,T,mu,phiS,CcS,rs,Aaa,beta][[1]]-steadystateplot[b,landaP,np,l,d,landaA*v2,phiA,kb,T,mu,phiS,CcS,rs,Aaa,beta][[1]])^2];Erreta[2]=0.5*Sqrt[(steadystateplot[b,landaP,1*10^20,l,d,landaA,phiA,kb,T,mu,phiS,CcS,rs*v1,Aaa,beta][[1]]-steadystateplot[b,landaP,1*10^20,l,d,landaA,phiA,kb,T,mu,phiS,CcS,rs*v2,Aaa,beta][[1]])^2+(steadystateplot[b,landaP,1*10^20,l*v1,d,landaA,phiA,kb,T,mu,phiS,CcS,rs,Aaa,beta][[1]]-steadystateplot[b,landaP,1*10^20,l*v2,d,landaA,phiA,kb,T,mu,phiS,CcS,rs,Aaa,beta][[1]])^2+(steadystateplot[b,landaP,1*10^20,l,d*v1,landaA,phiA,kb,T,mu,phiS,CcS,rs,Aaa,beta][[1]]-steadystateplot[b,landaP,1*10^20,l,d*v2,landaA,phiA,kb,T,mu,phiS,CcS,rs,Aaa,beta][[1]])^2+(steadystateplot[b,landaP,1*10^20,l,d,landaA,phiA*v1,kb,T,mu,phiS,CcS,rs,Aaa,beta][[1]]-steadystateplot[b,landaP,1*10^20,l,d,landaA*v2,phiA,kb,T,mu,phiS,CcS,rs,Aaa,beta][[1]])^2];Erreta[3]=0.5*Sqrt[(steadystateplot[b,landaP,2*10^20,l,d,landaA,phiA,kb,T,mu,phiS,CcS,rs*v1,Aaa,beta][[1]]-steadystateplot[b,landaP,2*10^20,l,d,landaA,phiA,kb,T,mu,phiS,CcS,rs*v2,Aaa,beta][[1]])^2+(steadystateplot[b,landaP,2*10^20,l*v1,d,landaA,phiA,kb,T,mu,phiS,CcS,rs,Aaa,beta][[1]]-steadystateplot[b,landaP,2*10^20,l*v2,d,landaA,phiA,kb,T,mu,phiS,CcS,rs,Aaa,beta][[1]])^2+(steadystateplot[b,landaP,2*10^20,l,d*v1,landaA,phiA,kb,T,mu,phiS,CcS,rs,Aaa,beta][[1]]-steadystateplot[b,landaP,2*10^20,l,d*v2,landaA,phiA,kb,T,mu,phiS,CcS,rs,Aaa,beta][[1]])^2+(steadystateplot[b,landaP,2*10^20,l,d,landaA,phiA*v1,kb,T,mu,phiS,CcS,rs,Aaa,beta][[1]]-steadystateplot[b,landaP,2*10^20,l,d,landaA*v2,phiA,kb,T,mu,phiS,CcS,rs,Aaa,beta][[1]])^2];
gk2=ListLogLogPlot[{metassdt0+Erreta[1],metassdt0-Erreta[1],metassdt1Poly+Erreta[2],metassdt1Poly-Erreta[2],metassdt2Poly+Erreta[3],metassdt2Poly-Erreta[3]},Joined{True,True},InterpolationOrder2,PlotStyle{Directive[Blue,Dotted],Directive[Blue,Dotted],Directive[Red,Dotted],Directive[Red,Dotted],Directive[Green,Dotted],Directive[Green,Dotted],Directive[Orange,Dotted],Directive[Orange,Dotted],Directive[Gray,Dotted],Directive[Gray,Dotted]},ImageSize{400,300},Filling{1{2},3{4},5{6},7{8},9{10}},PlotRange{{1,1000000},{.001,10}},FrameTrue,ImageSize{500,300}]
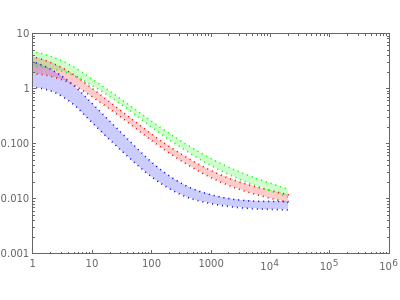
gg4k=Show[getass2,gk2]
 |
|
Export["error15%model.png",gg4k];
Cite this as: Ali Kariman Moghaddam, "Mesoscopic Theoretical Modeling and Experimental Study of Rheological Behavior of Water-Based Drilling Fluid Containing Associative Synthetic Polymer, Bentonite, and Limestone" from the Notebook Archive (2022), https://notebookarchive.org/2022-02-4m7rhk8
Download
