Machine Learning the Optimal Cryptocurrency Portfolio from Blockchain Activity
Author
Shivain Vij
Title
Machine Learning the Optimal Cryptocurrency Portfolio from Blockchain Activity
Description
Machine Learning the Optimal Cryptocurrency Portfolio from Blockchain Activity
Category
Essays, Posts & Presentations
Keywords
URL
http://www.notebookarchive.org/2019-08-0gjg7pc/
DOI
https://notebookarchive.org/2019-08-0gjg7pc
Date Added
2019-08-01
Date Last Modified
2019-08-01
File Size
2.93 megabytes
Supplements
Rights
Redistribution rights reserved

WOLFRAM SUMMER SCHOOL 2019
Machine Learning the Optimal Cryptocurrency Portfolio from Blockchain Activity
Machine Learning the Optimal Cryptocurrency Portfolio from Blockchain Activity
Shivain Vij
Mentor: Philip Maymin
Cryptocurrencies are notoriously unpredictable with traditional financial approaches. This project was intended to utilize historical blockchain activity to construct a machine learning algorithm that would be able to optimize intraday cryptocurrency portfolio allocations. The first part of the project was to create a program that would find the optimized portfolio of just Ethereum and Bitcoin for the current date that the code was executed. The optimization would be done so that the user would be investing with the maximum expected return with a minimal risk, which would be computed with the Sharpe Ratio. The second part was to create a manipulate of the optimized portfolio to show to a user that the optimized portfolio’s weights for the cryptocurrencies could not be beat. The manipulate was then opened up so that the user could change the circumstances of the program and the optimized portfolio would show the optimum weights of the cryptocurrencies. Following that, historical bitcoin blockchain data was collected for optimized portfolios to be inputted into a neural network machine learning algorithm to attempt to predict future bitcoin return rates. The return rates would then be used to compute an optimal portfolio.
Cryptocurrencies are notoriously unpredictable with traditional financial approaches. This project was intended to utilize historical blockchain activity to construct a machine learning algorithm that would be able to optimize intraday cryptocurrency portfolio allocations. The first part of the project was to create a program that would find the optimized portfolio of just Ethereum and Bitcoin for the current date that the code was executed. The optimization would be done so that the user would be investing with the maximum expected return with a minimal risk, which would be computed with the Sharpe Ratio. The second part was to create a manipulate of the optimized portfolio to show to a user that the optimized portfolio’s weights for the cryptocurrencies could not be beat. The manipulate was then opened up so that the user could change the circumstances of the program and the optimized portfolio would show the optimum weights of the cryptocurrencies. Following that, historical bitcoin blockchain data was collected for optimized portfolios to be inputted into a neural network machine learning algorithm to attempt to predict future bitcoin return rates. The return rates would then be used to compute an optimal portfolio.
1. Portfolio Optimization for Current Date
1. Portfolio Optimization for Current Date
1.1 Collect Raw Financial Data for Bitcoin and Ethereum
1.1 Collect Raw Financial Data for Bitcoin and Ethereum
portfolio - A list of cryptocurrencies to be included in the portfolio. BTC is Bitcoin and ETH is Ethereum.
In[]:=
portfolio={"BTC","ETH"};
data - A 2 part variable that contains both the historical values of Bitcoin and Ethereum, with Bitcoin being the first, and Ethereum being second. The range is set to be from 2010 to 2020 to ensure that no data is being excluded.
In[]:=
data=FinancialData[#,{{2010},{2020}}]&/@portfolio;
Re-Initializing data to only contain dates that are common between the historical values of Bitcoin and Ethereum. This is done using the function TimeSeriesResample with the parameter Intersection.
In[]:=
data=TimeSeriesResample[{data[[1]],data[[2]]},"Intersection"];
1.2 Process Raw Data for Optimization Function
1.2 Process Raw Data for Optimization Function
The optimization function will require the historical return rates of both Bitcoin and Ethereum, the Standard Deviation of both Bitcoin and Ethereum, and the correlation between the 2 cryptocurrencies.
returns - Another 2 part variable that contains the Logarithmic returns of the historical financial data collected in 1.1. This data will be smaller by 1 element because the equation for finding Logarithmic returns requires 2 dates in order to compute a difference in the values.
In[]:=
returns=Differences@*Log/@data[[All,All,2]];
btcSD and ethSD - 2 variables that contain the Standard Deviation of Bitcoin and Ethereum respectively by using the StandardDeviation function and the returns that we calculated in the last step.
In[]:=
btcSD=StandardDeviation[returns[[1]]];ethSD=StandardDeviation[returns[[2]]];
correlated - A variable that uses the Correlation function with the returns of Bitcoin and Ethereum. The correlation refers to how similar the cryptocurrencies fluctuate, which is evident in the first graphic of the notebook.
In[]:=
correlated=Correlation[returns[[1]],returns[[2]]];
What is correlation?
Create a function called optimize with the parameters: Bitcoin return rate, Ethereum return rate, Bitcoin Standard Deviation, Ethereum Standard Deviation, and Correlation between the 2 cryptocurrencies. The function optimize will use NMaximize, which is a Wolfram function, to calculate a weight for Bitcoin that will maximize the Sharpe Ratio, which refers to safe an investment is estimated to be. The allocation of funds to Bitcoin is represented by the variable weight, and the allocation of funds for Ethereum is represented by (1 - weight).
In[]:=
optimize[btcreturn_,ethreturn_,btcsd_,ethsd_,correlation_]:=NMaximize[{Sqrt[252](weight*btcreturn+(1-weight)*ethreturn)/Sqrt[btcsd^2*weight^2+ethsd^2*(1-weight)^2+(2*correlation*btcsd*ethsd)*weight*(1-weight)],1≥weight≥0},weight]
The cell below will input the previously collected data into the optimize function we just created to calculate the Current optimized portfolio.
In[]:=
optimize[Mean[returns[[1]]],Mean[returns[[2]]],btcSD,ethSD,correlated]
Out[]=
{1.20434,{weight0.640618}}
1.3 Wrap Everything in a Manipulate
1.3 Wrap Everything in a Manipulate
The Manipulate below allows a user to change all the variables of the data we previously collected and see what the optimized portfolio is given the user’s input in a live environment.
In[]:=
Manipulate[Sqrt[252.](weight*btcreturn+(1-weight)*ethreturn)/Sqrt[btcsd^2*weight^2+ethsd^2*(1-weight)^2+(2*correlation*btcsd*ethsd)*weight*(1-weight)](optimize[btcreturn,ethreturn,btcsd,ethsd,correlation]),{weight,0,1},{{btcreturn,Mean[returns[[1]]]},0,1},{{ethreturn,Mean[returns[[2]]]},0,1},{{btcsd,btcSD},0,1},{{ethsd,ethSD},0,1},{{correlation,correlated},0,1}]
Out[]=
| |||||||||||||||||||||||||||
| |||||||||||||||||||||||||||
2. Machine Learning Returns
2. Machine Learning Returns
2.1 Collect Data for Machine Learning (Bitcoin)
2.1 Collect Data for Machine Learning (Bitcoin)
BTCtransData - This variable contains the daily transaction history for Bitcoin, which will be collected by Importing the dataset as Data and formatting it to work correctly as a TimeSeries. Rest is used to remove the first row of the list, which removes the headers of the columns. The data that is used is originally from Bitcoinity, but is being imported from my GitHub for this project.
In[]:=
BTCtransData=TimeSeries[{Take[First[#],3],#2}&@@@Rest[Flatten[Transpose[Import["https://github.com/ShivainVij/Cryptocurrency_Machine_Learning_Portfolio/raw/master/Dataset/BitcoinTransactionHistory.xlsx","Data"]],1]]];
BTCValuedata - A variable that contains only Bitcoin’s historical value.
In[]:=
BTCValuedata=FinancialData["BTC",{{2016,7,17},CurrentDate[]}];
BTCallData - A 2 part variable that uses the TimeSeriesResample with Intersection to eliminate all data that is uncommon from both datasets in terms of dates.
In[]:=
BTCallData=TimeSeriesResample[{BTCValuedata,BTCtransData},"Intersection"];
BTCreturns - A variable that contains all of Bitcoin’s historical return rates
In[]:=
BTCreturns=Differences@*Log@BTCallData[[1,All,2]];
2.2 Creating a Neural Network (Bitcoin)
2.2 Creating a Neural Network (Bitcoin)
BTCml - A Neural Network that takes Bitcoin’s historical transaction data as the inputs and returns Bitcoin’s historical return rates as the output. The Neural Network uses the Predict function.
In[]:=
BTCml=Predict[Flatten[Rest[BTCallData[[2,All,2]]]]BTCreturns,PerformanceGoal"Quality",Method"NeuralNetwork"];
BTCvar - This variable will store our previously made association between the Bitcoin transaction data as the input and BTCreturns as the outputs. This will make it easier to type later. BTCvar will act as our test data.
In[]:=
BTCvar=Rest[BTCallData[[2,All,2]]]BTCreturns;
BTCpml - Using PredictorMeasurements, BTCpml will be tested against its own training data, which is stored in BTCvar.
In[]:=
BTCpml=PredictorMeasurements[BTCml,BTCvar];
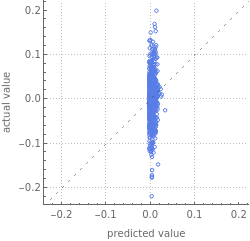
After opening BTCpml’s Report, we can clearly see the machine learning algorithm was unable to identify any correlation between Bitcoin transaction history and Bitcoin value. The algorithm was guessing near 0 every time. If the machine learning algorithm performed well, the dots would have been along the dotted line.
In[]:=
BTCpml["Report"]
Out[]=
Predictor Measurements | ||||||||||||||
| ||||||||||||||
Predictor Measurements | ||||||||||||||
| ||||||||||||||
Even though there is no evident correlation between historical Bitcoin blockchain data and Bitcoin’s return rates. Even so, we can test the same method on Ethereum.
2.3 Collecting Data for Machine Learning (Ethereum)
2.3 Collecting Data for Machine Learning (Ethereum)
ETHtransData - This variable contains the daily transaction history for Ethereum, which will be collected by Importing the dataset as Data and formatting it to work correctly as a TimeSeries. Rest is used to remove the first row of the list, which removes the headers of the columns. The data that is used is originally from Etherscan, but is being imported from my GitHub for this project.
In[]:=
ETHtransData=Quiet@TimeSeries[Rest[Import["https://raw.githubusercontent.com/ShivainVij/Cryptocurrency_Machine_Learning_Portfolio/master/Dataset/ETHTransactionHistory.csv","Data"]]];
ETHValuedata - A variable that contains only Ethereum’s historical value.
In[]:=
ETHValuedata=FinancialData["ETH",{{2016,7,17},CurrentDate[]}];
ETHallData - A 2 part variable that uses the TimeSeriesResample with Intersection to eliminate all data that is uncommon from both datasets in terms of dates.
In[]:=
ETHallData=TimeSeriesResample[{ETHValuedata,ETHtransData},"Intersection"];
ETHreturns - A variable that contains all of Ethereum’s historical return rates
In[]:=
ETHreturns=Differences@*Log@ETHallData[[1,All,2]];
2.4 Creating a Neural Network (Ethereum)
2.4 Creating a Neural Network (Ethereum)
ETHml - A Neural Network that takes Ethereum’s historical transaction data as the inputs and returns Ethereum’s historical return rates as the output. The Neural Network uses the Predict function.
In[]:=
ETHml=Predict[Flatten[Rest[ETHallData[[2,All,2]]]]ETHreturns,PerformanceGoal"Quality",Method"NeuralNetwork"];
ETHvar - This variable will store our previously made association between the Ethereum transaction data as the input and ETHreturns as the outputs. This will make it easier to type later. ETHvar will act as our test data.
In[]:=
ETHvar=Rest[ETHallData[[2,All,2]]]ETHreturns;
ETHpml - Using PredictorMeasurements, ETHpml will be tested against its own training data, which is stored in ETHvar.
In[]:=
ETHpml=PredictorMeasurements[ETHml,ETHvar];
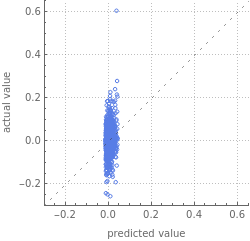
After opening ETHpml’s Report, we can clearly see the machine learning algorithm was unable to identify any correlation between Ethereum transaction history and Ethereum value. The algorithm was guessing near 0 every time. If the machine learning algorithm performed well, the dots would have been along the dotted line. These results are very similar to the ones from the Bitcoin Neural Network.
In[]:=
ETHpml["Report"]
Out[]=
Predictor Measurements | ||||||||||||||
| ||||||||||||||
Predictor Measurements | ||||||||||||||
| ||||||||||||||
2.5 Collect Monthly Data for Machine Learning (Bitcoin)
2.5 Collect Monthly Data for Machine Learning (Bitcoin)
Since cryptocurrencies are so volatile and can change dramatically in a single day, looking at daily data may prove to be harmful to the success of our Neural Network. To resolve this, we can look at Monthly data instead.
monthlyTransData - This variable contains the monthly transaction history for Bitcoin, which will be collected by Importing the dataset as Data and formatting it to work correctly as a TimeSeries.
In[]:=
monthlyTransData=TimeSeries[Rest[Import["https://raw.githubusercontent.com/ShivainVij/Cryptocurrency_Machine_Learning_Portfolio/master/Dataset/BitcoinMonthlyTransactionData.csv","Data"]]];
Initialize monthlydata to only contain Bitcoin’s historical value. Then, create the 2 part variable monthlyallData which will use TimeSeriesResample with Intersection to eliminate any data that is uncommon from both datasets in terms of dates.
In[]:=
monthlydata=FinancialData["BTC",{{2016,7,1},CurrentDate[]}];monthlyallData=TimeSeriesResample[{monthlydata,monthlyTransData},"Intersection"];
monthlyreturns - A variable that contains all the monthly returns for Bitcoin
In[]:=
monthlyreturns=Differences@*Log@monthlyallData[[1,All,2]];
2.6 Creating a Neural Network for Monthly Data (Bitcoin)
2.6 Creating a Neural Network for Monthly Data (Bitcoin)
monthlyml - A Neural Network that takes Bitcoin’s monthly historical transaction data as the inputs and returns Bitcoin’s historical monthly return rates as the output. The Neural Network uses the Predict function.
In[]:=
monthlyml=Predict[Rest[Flatten[monthlyallData[[2,All,2]]]]monthlyreturns,PerformanceGoal"Quality",Method"NeuralNetwork"];
monthlyvar - This variable will store our previously made association between the Bitcoin monthly transaction data as the input and monthlyreturns as the outputs. This will make it easier to type later. monthlyvar will act as our test data.
In[]:=
monthlyvar=Rest[monthlyallData[[2,All,2]]]monthlyreturns;
monthlypml - Using PredictorMeasurements, monthlypml will be tested against its own training data, which is stored in monthlyvar.
In[]:=
monthlypml=PredictorMeasurements[monthlyml,monthlyvar];
After opening monthlypml’s Report, we can see that the data is much better than the data we saw with daily values. The values are more spread out, which makes the data much more interesting.
In[]:=
monthlypml["Report"]
Out[]=
Predictor Measurements | ||||||||||||||
| ||||||||||||||
We can also graph the data in another way to better see how well the Neural Network performed.
We can also graph the data in another way to better see how well the Neural Network performed.
To properly graph our Neural Network some more data will need to be collected. To begin, we can get the Bitcoin monthly correlation.
In[]:=
BTCmonthlyCorrelation=Correlation[Select[Transpose[{monthlyml[Rest[monthlyallData[[2,All,2]]],"Decision"],monthlyreturns}],First@#>-10000&]];
Next, we must calculate the linear model using Transpose and store it in lm
In[]:=
lm=LinearModelFit[Transpose[{monthlyml[Rest[monthlyallData[[2,All,2]]],"Decision"],monthlyreturns}],x,x];
Now, everything can be put into a ListPlot.
In[]:=
ListPlot[Transpose[{monthlyml[Rest[monthlyallData[[2,All,2]]],"Decision"],monthlyreturns}],EpilogStyle[Line[{#,lm[#]}&/@{-.5,.5}],Red],AspectRatio1,PlotLabelRow[{"Correlation:",Style[PercentForm[BTCmonthlyCorrelation[[1,2]]],Red]},Spacer[2]],AxesLabel{"Predicted","Actual"},PlotRangeAll]
Out[]=
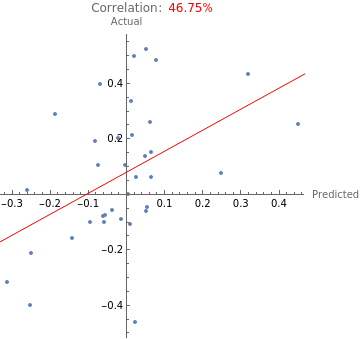
The red line on the graph shows the general trend of the data, which is fairly accurate given that a fully accurate Neural Network’s trend line would start at the origin and would have slope 1, which is fairly similar to this trend line. The correlation is also near 50% which is fairly good given the results from the daily data.
We can also calculate how much of the variance the Neural Network can explain using RSquared
We can also calculate how much of the variance the Neural Network can explain using RSquared
In[]:=
lm["RSquared"]
0.218566
This shows that for monthly data, the Neural Network can only explain 20% of the variance in the returns, which is not very accurate.
2.7 Changing Date Range for Data Collection (Bitcoin)
2.7 Changing Date Range for Data Collection (Bitcoin)
If we look at all the historical data for Bitcoin, we can clearly see that Bitcoin is fairly inactive for a long period of time before it really became recognized as a currency.
In[]:=
DateListPlot[FinancialData["BTC",{{2016},CurrentDate[]}]]
Out[]=

Data with dead zones such as this would have obvious negative impacts on how well our Neural Net would perform. To resolve this, we can remove 2 years worth of data to see how well a Neural Net trained with data from the recent past would perform.
BTCtransData can be reused again since it will be cut down to the size of the FinancialData once we remove all uncommon dates with TimeSeriesResample.
trimmedBTCValuedata - A variable that contains only Bitcoin’s historical value from 2018.
In[]:=
trimmedBTCValuedata=FinancialData["BTC",{{2018,7,17},CurrentDate[]}];
trimmedBTCallData - A 2 part variable that uses the TimeSeriesResample with Intersection to eliminate all data that is uncommon from both datasets in terms of dates.
In[]:=
trimmedBTCallData=TimeSeriesResample[{trimmedBTCValuedata,BTCtransData},"Intersection"];
trimmedBTCreturns - A variable that contains all of Bitcoin’s historical return rates from 2018
In[]:=
trimmedBTCreturns=Differences@*Log@trimmedBTCallData[[1,All,2]];
2.8 Creating a Neural Network for Trimmed Dates (Bitcoin)
2.8 Creating a Neural Network for Trimmed Dates (Bitcoin)
trimmedBTCml - A Neural Network that takes Bitcoin’s historical transaction data from 2018 as the inputs and returns Bitcoin’s historical return rates as the output. The Neural Network uses the Predict function.
In[]:=
trimmedBTCml=Predict[Flatten[Rest[trimmedBTCallData[[2,All,2]]]]trimmedBTCreturns,PerformanceGoal"Quality",Method"NeuralNetwork"];
trimmedBTCvar - This variable will store our previously made association between the Bitcoin transaction data as the input and trimmedBTCreturns as the outputs. This will make it easier to type later. trimmedBTCvar will act as our test data.
In[]:=
trimmedBTCvar=Rest[trimmedBTCallData[[2,All,2]]]trimmedBTCreturns;
trimmedBTCpml - Using PredictorMeasurements, trimmedBTCpml will be tested against its own training data, which is stored in trimmedBTCvar.
In[]:=
trimmedBTCpml=PredictorMeasurements[trimmedBTCml,trimmedBTCvar];
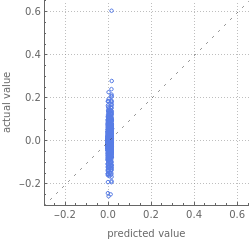
After opening trimmedBTCpml’s Report, we can clearly see the machine learning algorithm was unable to identify any correlation between Bitcoin transaction history from 2018 and Bitcoin value. The algorithm was guessing near 0 every time. If the machine learning algorithm performed well, the dots would have been along the dotted line. However, the idea behind using trimmed data still appears promising, so it will be tested in next sections.
In[]:=
trimmedBTCpml["Report"]
Out[]=
Predictor Measurements | ||||||||||||||
| ||||||||||||||
3. Predicting Optimized Portfolio
3. Predicting Optimized Portfolio
3.1 Edit Manipulate from Section 1.3
3.1 Edit Manipulate from Section 1.3
The next step is to calculate the optimized portfolio over a given date range in order to be able to calculate the historical optimized portfolio. This is done by removing the user’s option to edit variables such as return rates, and replacing them with the ability to edit a specific date range.
In[]:=
Manipulate[date=DatePlus[Today,{EndDate,"Days"}];data=FinancialData[#,{date-Quantity[DaysBeforeEndDate,"Days"],date}]&/@portfolio;dataSelected=TimeSeriesResample[{data[[1]],data[[2]]},"Intersection"];returns=Differences@*Log/@dataSelected[[All,All,2]];btcSD=StandardDeviation[returns[[1]]];ethSD=StandardDeviation[returns[[2]]];correlated=Correlation[returns[[1]],returns[[2]]];Column[{date,optimize[Mean[returns[[1]]],Mean[returns[[2]]],btcSD,ethSD,correlated]},Center],{{DaysBeforeEndDate,126},{5,21,63,126,252},ControlTypeSetterBar},{EndDate,-993,0,1}]
Out[]=
| ||||||||||||||||
| ||||||||||||||||
3.2 Collecting All Historical Optimized Data
3.2 Collecting All Historical Optimized Data
historicalOptimized - A variable that contains historically optimized data. The optimized data is collected for 21 days worth of data. The data also only includes 600 of the most recent data points in order to ignore data from the time periods that were discussed earlier in Section 2.
In[]:=
historicalOptimized=Table[date=DatePlus[Today,{EndDate,"Days"}];data=FinancialData[#,{date-Quantity[21,"Days"],date}]&/@{"BTC","ETH"};dataSelected=TimeSeriesResample[{data[[1]],data[[2]]},"Intersection"];returns=Differences@*Log/@dataSelected[[All,All,2]];btcSD=StandardDeviation[returns[[1]]];ethSD=StandardDeviation[returns[[2]]];correlated=Correlation[returns[[1]],returns[[2]]];optimize[Mean[returns[[1]]],Mean[returns[[2]]],btcSD,ethSD,correlated],{EndDate,-600,0,1}]~Monitor~{date-Quantity[21,"Days"],date};
listedHistoricalOptimized - A variable that includes the formatted data from historicalOptimized so that it only includes the weights and can be used.
In[]:=
listedHistoricalOptimized=Flatten[Values[historicalOptimized[[All,2]]]];
Since we already have Bitcoin and Ethereum’s past transaction data from previous sections, we have all the data we need to continue onto training the Machine Learning algorithm.
3.3 Create Machine Learning Algorithm to Predict Optimized Portfolio from Bitcoin and Ethereum Transaction Data
3.3 Create Machine Learning Algorithm to Predict Optimized Portfolio from Bitcoin and Ethereum Transaction Data
optalldata - A variable that contains the filtered dates of all the sets of data so that no data is included that does not match with the other datasets.
In[]:=
optalldata=TimeSeriesResample[{BTCtransData,ETHtransData},"Intersection"];
transpose - A variable that will contain about 600 points of data for both the transaction data of Bitcoin and Ethereum in the form of an association so that it can be inputted into the Predict function to train the machine learning algorithm.
In[]:=
transpose=Take[Transpose[{optalldata[[1,All,2]],optalldata[[2,All,2]]}],-Length[listedHistoricalOptimized]];
optml - The machine learning algorithm that will use Predict to take transpose as the input and output the listedHistoricalOptimized.
In[]:=
optml=Predict[transposelistedHistoricalOptimized,PerformanceGoal"Quality",MethodAutomatic];
poptml - Using PredictorMeasurements, optml will be tested to determine how well it can Predict listedHistoricalOptimized when given transpose.
In[]:=
poptml=PredictorMeasurements[optml,transposelistedHistoricalOptimized];
Now we can get the report to see how well it performed
In[]:=
poptml["Report"]
Out[]=
Predictor Measurements | ||||||||||||||
| ||||||||||||||
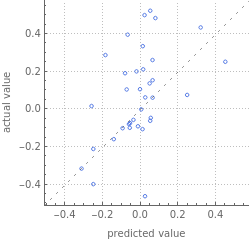
The data is much more diverse than it has been in the previous Neural Networks. Let’s investigate this further by plotting the data onto another graph.
To properly graph our Machine Learning Algorithm some more data will need to be collected. To begin, we can get the Correlation.
In[]:=
optallCorrelation=Correlation[Transpose[{optml[transpose],listedHistoricalOptimized}]];
Next, we must calculate the linear model using Transpose and store it in optmllm
In[]:=
optmllm=LinearModelFit[Transpose[{optml[transpose],listedHistoricalOptimized}],x,x];
Now, everything can be put into a ListPlot.
In[]:=
ListPlot[Transpose[{optml[transpose],listedHistoricalOptimized}],EpilogStyle[Line[{#,optmllm[#]}&/@{0,1}],Red],AspectRatio1,PlotLabelRow[{"Correlation:",Style[PercentForm[optallCorrelation[[1,2]]],Red]},Spacer[2]],AxesLabel{"Predicted","Actual"},PlotRangeAll]
Out[]=

As we can see in the graph, the machine learning algorithm could identify over a 75% correlation between Blockchain transaction data and an optimized portfolio. This is very strong. To continue on, we can calculate how much of the variance in the optimal portfolio weights that the Machine Learning algorithm can explain using RSquared
In[]:=
optmllm["RSquared"]
Out[]=
0.58013
This means that the Machine Learning algorithm can explain 60% of the variance in the optimal weights. So looking at Bitcoin and Ethereum transaction data can explain more than half of the variance in optimized portfolio weights.
4. Conclusion & Future
4. Conclusion & Future
In conclusion, Neural Networks can be used to predict optimized portfolios in the future, however they would require much more and better data to be accurate to the point. For this, there are many different extensions for the project. One of the many extensions is to take into account new users and old users and trading history of users to identify possible enterprise level transactions, since the enterprises that perform these transactions may not be influenced by the same things that regular individual consumers are. Furthermore, the prices and how many people bought ASICS or any other mining related hardware can also be investigated, since the mining of Bitcoins can impact the blockchain’s number of Bitcoin transactions. Shifting our focus to the regular individual consumer, further research could include analyzing news articles consisting of majority of the key words “bitcoin prices expected to rise says expert analyst” since phrases such as this can cause a consumer who would normally not be interested in cryptocurrencies to invest. Analyzing the volatility right before cryptocurrency price experiences dramatic change like the bitcoin spike and fork can also provide more insight into what influences consumer confidence in Bitcoin. Finally, adding more cryptocurrencies into the program would also provide more possibilities for the optimized portfolio, but right now, only bitcoin and Ethereum are supported by Wolfram. It is always possible to add more manually using data found online but that data would have to be formatted properly.
Cite this as: Shivain Vij, "Machine Learning the Optimal Cryptocurrency Portfolio from Blockchain Activity" from the Notebook Archive (2019), https://notebookarchive.org/2019-08-0gjg7pc
Download


