The distribution of amino acid changes in different species
Author
Zhamilya Bilyalova
Title
The distribution of amino acid changes in different species
Description
Analysis and comparison of A=to-I RNA editing in cephalopod species (squids and octopuses) and humans.
Category
Essays, Posts & Presentations
Keywords
biology, genetics, amino, acid, graph, plot, visualization
URL
http://www.notebookarchive.org/2019-02-b3xrfr7/
DOI
https://notebookarchive.org/2019-02-b3xrfr7
Date Added
2019-02-24
Date Last Modified
2019-02-24
File Size
1.25 megabytes
Supplements
Rights
Redistribution rights reserved

The distribution of amino acid changes in different species
The distribution of amino acid changes in different species
Analysis and comparison of A=to-I RNA editing in cephalopod species (squids and octopuses) and humans.
Zhamilya Bilyalova, Jun. 24, 2018
Introduction: What is RNA editing?
Introduction: What is RNA editing?
RNA editing is a process that changes a RNA transcript such that it would no longer correspond to a sequence of DNA in a genome. There are many types of changes. A-to-I RNA editing is widespread in animals and results in the modification of a adenosine to inosine which will be read as a guanine. Nucleotides are being changed by enzymes that catalyze the editing.
Nucleobases that participate in A-to-I editing in mRNA:
In[]:=
Grid[{Map[Labeled[ChemicalData[#],#,Left]&,{"Inosine","Adenine","Guanine"}]},Spacings2]
Out[]=
|
|
|


A-to-I editing in messenger RNA (mRNA) can cause changes in the amino acid sequence of a protein (amino acid recoding). Codons, 64 combinations in total, are codes for specific amino acids (one amino acid can relate to more than one codon).
To find what codons correspond to a specific amino acid, we can implement this code: An example is given for amino acid glycine:
In[]:=
glycine | CHEMICAL |
Out[]=
{GGU,GGC,GGA,GGG}
Properties of a specific amino acid:
In[]:=
glycine | CHEMICAL |
And this is a table of amino acids and their corresponding codons: header
In[]:=
Grid[Map[{#,#[EntityProperty["Chemical","Codons"]]}&,Interpreter["Chemical"][{"Ser","Gly","Cys","Phe","Leu","Tyr","tryptophan","Arg","histidine","Gln","Pro","Ile","Met","Val","Ala","Asn","Lys","Asp","Glu"}]],FrameAll]
Out[]=
L-serine | {UCU,UCC,UCA,UCG,AGU,AGC} |
glycine | {GGU,GGC,GGA,GGG} |
L-cysteine | {UGU,UGC} |
L-phenylalanine | {UUU,UUC} |
L-leucine | {UUA,UUG,CUU,CUC,CUA,CUG} |
L-tyrosine | {UAU,UAC} |
L-tryptophan | {UGG} |
L-arginine | {CGU,CGC,CGA,CGG,AGA,AGG} |
L-histidine | {CAU,CAC} |
L-glutamine | {CAA,CAG} |
L-proline | {CCU,CCC,CCA,CCG} |
L-isoleucine | {AUU,AUC,AUA} |
L-methionine | {AUG} |
L-valine | {GUU,GUC,GUA,GUG} |
L-alanine | {GCU,GCC,GCA,GCG} |
L-asparagine | {AAU,AAC} |
L-lysine | {AAA,AAG} |
L-aspartic acid | {GAU,GAC} |
L-glutamic acid | {GAA,GAG} |
Goal of this essay and description of the data
Goal of this essay and description of the data
It was recently discovered that RNA editing and amino acid changes are widespread in cephalopods. In this essay, I attempt to analyse and compare the distribution of amino acid changes in cephalopod species (Squid, Sepia, Octopus vulgaris, Octopus bimaculoides) and human.
The data set consists of calculated expected distribution ("Expected amount", "Expected frequency") and observed distribution ("Edits", "Frequency") of amino acid changes in humans, four cephalopod species, and conserved edits from those species. KR represents a change from amino acid K to amino acid R. "syn" means synonymous, does not make any changes to amino acid and is likely to not have an effect. "stop_W" means stop to w and causes a significant change in a protein sequence.
Data
Data
In[]:=
data=SemanticImport@URLDownload["https://github.com/ZhamilyaB/Summer2018Starter/raw/master/Computational%20Essay/editingcodonsimplifieddata.csv"];
Out[]=
| ||||||||||||||||||||||||||||||||||||||||||||||||||||||||||||||||||||||||||||||||||||||||||||||||||||||||||||||||||||||||||||||||||||||||||||||||||||||||||||||||||||||||||||||||||||||||||||||||||||||||||||||||||||||||||||||||
All types of amino acids changes are categorized as either radical or conserved. Radical changes are those that change the physicochemical property of the amino acid while conservative changes do not. The ratio of radical to conservative changes indicates how many changes are likely to have a negative effect.
Out[]=
|
Assumptions
Assumptions
Amino acid changes also can be random or non-random: Random edits are likely to be slightly bad and don’t make an animal better, Non-random edits are likely to be good, be actively preserved in the population and seen more in conserved. In humans most changes are random, therefore, they are most likely to have a negative effect. In Individual cephalopod species, amino acid changes are a lot less random and they are less likely to have a negative effect. In conserved, changes are least random and most likely to have a positive effect.
Visualisation and Exploration
Visualisation and Exploration
Expected frequency vs. actual frequency
Expected frequency vs. actual frequency
Out[]=
human
specific_sepia
conserved_cephalopods
specific_oct_bim
specific_squid
specific_oct_vul
Frequency |
| ||||||||||||||||||||||||||||||||||||||||
| Expected Frequency |

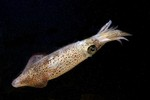
For importing images I was using Wolfram|Alpha Query, which is a very helpful tool to find correct images and more information on a subject right inside Mathematica.
In[]:=
Squid image
| ||||||||||
| ||||||||||
| ||||||||||

In[]:=
squids | SPECIES SPECIFICATION |
image
Out[]=
The comparison of frequencies of changes in all species
The comparison of frequencies of changes in all species
The comparison of frequencies of changes in all species
With this plot we are trying to explore the amino acid changes that are
1) the most different and the most similar in all of the species.
2) how and why are they different or similar?
3) and what is the general pattern?
Out[]=
Changes |
| |||||||||||||||||
| Frequency |

First observation:
Humans have a different pattern from each one of cephalopod species, but cephalopod species together have a similar pattern which means that this amino acid preference is connected to cephalopod species being special.
Humans have a different pattern from each one of cephalopod species, but cephalopod species together have a similar pattern which means that this amino acid preference is connected to cephalopod species being special.
Out[]=
Changes |
| |||||||||||||||||
| Frequency |
Second observation:
EG, TA, KE changes in human are most different and therefore are more likely to have a negative effect. As well contributed to cephalopod species being special.
If we check these three changes, it turns out: EG, KE are radical changes and TA is conserved which doesn’t disprove our assumptions.
EG, TA, KE changes in human are most different and therefore are more likely to have a negative effect. As well contributed to cephalopod species being special.
If we check these three changes, it turns out: EG, KE are radical changes and TA is conserved which doesn’t disprove our assumptions.
The comparison of amount of changes in cephalopod species
The comparison of amount of changes in cephalopod species
Out[]=
Changes |
| |||||||||||||||||
| Edits |

Observation:
Squid and sepia have more similar number of edits compared to oct_bim and oct_vul because they are just different kinds of octopus.
Squid and sepia have more similar number of edits compared to oct_bim and oct_vul because they are just different kinds of octopus.
Out[]=
Changes |  |
| Edits |
By applying Logarithmic function we can clearly see the pattern of amino acid changes in each species is very similar and different from human
Out[]=
Changes |  |
| Edits |
Frequencies in different species
Frequencies in different species
How are the distribution different/similar between different species?
Out[]=
Species |
| ||||||||||||||||||||||||||||||||||||||||
| Frequency |

First, we notice that KR and synonymous are conserved. We can observe that they have higher frequency in cephalopod species which means that the ratio of radical to conserved in cephalopod species is less than this ratio in humans and conserved_cephalopods. Which is exactly the difference in ratios of radical to conserved in all the species from the research.
Ratio of radical to conserved:
Out[]=
|
Further explorations
Further explorations
Trade-off between Transcriptome Plasticity and Genome Evolution in Cephalopods, Cell 169, 191–202 (2017).
Author contact information
Author contact information
zhamilya.bilyalova@prismsus.org
Cite this as: Zhamilya Bilyalova, "The distribution of amino acid changes in different species" from the Notebook Archive (2018), https://notebookarchive.org/2019-02-b3xrfr7
Download
