The k-means algorithm
Author
Laney Moy
Title
The k-means algorithm
Description
Detailed walkthrough and visualization of the k-means algorithm
Category
Essays, Posts & Presentations
Keywords
Clustering, Computational Essay, Visualization, Math, K-Means, Machine Learning
URL
http://www.notebookarchive.org/2020-10-0ikidvb/
DOI
https://notebookarchive.org/2020-10-0ikidvb
Date Added
2020-10-01
Date Last Modified
2020-10-01
File Size
218.7 kilobytes
Supplements
Rights
Redistribution rights reserved

The k-means algorithm
The k-means algorithm
Laney Moy
Given a set of points and an integer k, the k-means algorithm uses a simple iterative process to find k values defining k clusters. In this essay, we will walk through the process of the k-means algorithm and compare it to FindClusters in the Wolfram Language.
Overview
Overview
The k-means algorithm initially generates k random “means” and assigns each point to the nearest mean, forming clusters. Each mean then becomes the average of the points in its cluster. The algorithm next assigns each point to the nearest of the updated means, creating new clusters. By repeating the process of assigning clusters and calculating new means until points no longer move between clusters, the k-means algorithm finds k means and clusters in the original data.
Assigning clusters
Assigning clusters
Let’s start with a list of points. I generated these randomly and then curated them to yield a more cluster-like distribution.
Create and display a list of points:
In[]:=
points=
;Graphics[Point@points,AxesTrue]
Out[]=
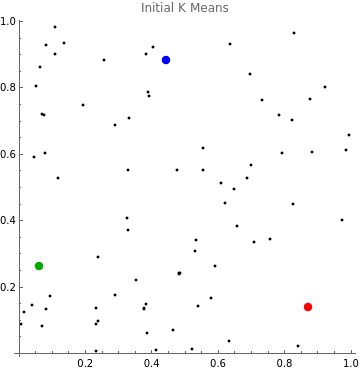
In this example, we’ll be working with a k of three, which means that we’re identifying three clusters. We randomly generate three points to serve as our initial k means, shown here in red, blue, and green.
Generate three pairs of random points, create an association from each point to its color, and display the starting means as well as our initial data:
In[]:=
means=RandomReal[{0,1},{3,2}]colors=AssociationThread[means,{Red,Blue,Darker@Green}];Graphics[{Point@points,PointSize[.025],Table[{colors[m],Point@m},{m,means}]},Axes->True,PlotLabel"Initial K Means"]
Out[]=
{{0.871791,0.138929},{0.441909,0.885358},{0.0600035,0.26308}}
Out[]=
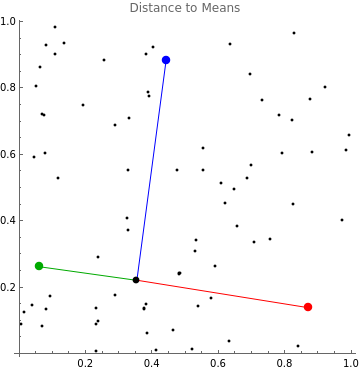
For a point, we calculate its distance from each of the three means
Choose a point and display the distances from each mean:
In[]:=
current=points[[31]];Legended[Graphics[{Point@points,PointSize[.025],Table[{colors[m],Point@m,Line[{current,m}]},{m,means}],PointSize[.02],Point@current},Axes->True,PlotLabel"Distance to Means"],SwatchLegend[colors/@means,EuclideanDistance[current,#]&/@means]]
Out[]=
 |
|
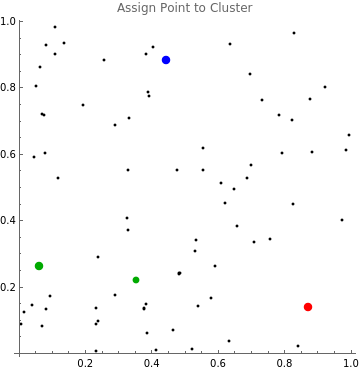
The point is assigned to the cluster of the nearest mean.
Display the point in the color of the nearest cluster:
In[]:=
nearestMean=Nearest[means,current][[1]];Graphics[{Point@points,PointSize[.025],Table[{colors[m],Point@m},{m,means}],PointSize[.02],colors[nearestMean],Point@current},Axes->True,PlotLabel"Assign Point to Cluster"]
Out[]=
We repeat the process on every point in the data set. The function clusterAll assigns each point to the cluster of the nearest mean and returns an Association pointing from each mean to the list of points in its cluster.
A function that clusters points and returns an Association of means and list of points in their respective clusters:
In[]:=
clusterAll[mns_,pts_]:=Module[{clusters},clusters=<|#{}&/@mns|>;AppendTo[clusters[Nearest[mns,#][[1]]],#]&/@pts;clusters]
Now that we can create cluster Associations, we write a display function to visualize our clusters.
A function that returns a Graphics object containing the appropriately colored points and means:
In[]:=
display[mns_,clsts_,clrs_]:=Graphics[{Table[{clrs[m],PointSize[.01],Point@clsts[m],PointSize[.025],Point@m},{m,mns}]},Axes->True]
Let’s try our new functions on our list of points by clustering all the points and displaying the color-coded clusters.
Cluster points based on their nearest mean and display the results:
In[]:=
clusters=clusterAll[means,points];Labeled[display[means,clusters,colors],"Cluster All",Top]
Out[]=
Cluster All |
Updating means
Updating means
After partitioning the data into clusters, we want each mean to better represent its respective cluster. We move the first mean (in red) from its current position to the average of the points in its cluster.
Save the current means as oldMeans and replace the first mean in means with the average value of the points in its cluster:
In[]:=
oldMeans=means;oldClusters=clusters;means[[1]]=Mean[clusters[means[[1]]]];
Use AssociationThread to update the Keys for clusters and colors:
In[]:=
clusters=AssociationThread[means,Values@clusters];colors=AssociationThread[means,Values@colors];
Display the new clusters along with an arrow indicating the movement of the first mean:
In[]:=
Show[Graphics[{colors[means[[1]]],PointSize[.025],Opacity[.25],Point@oldMeans[[1]],Arrow[{oldMeans[[1]],means[[1]]}]},Axes->True,PlotLabel"Move a Mean to the Average of Its Cluster"],display[means,clusters,colors]]
Out[]=

Using the function calcNewMeans, we can calculate new means based on the clusters of points. calcNewMeans returns a list newVals that contains the list of new means, an Association of new means to their current clusters, and an Association of the new means to their respective colors if applicable.
A function that calculates updated means and creates new cluster and color Associations with the updated means:
In[]:=
calcNewMeans[mns_,clsts_,clrs_:Nothing]:=Module[{newVals={}},AppendTo[newVals,If[Length[clsts[#]]>0,Mean[clsts[#]],#]&/@mns];AppendTo[newVals,AssociationThread[newVals[[1]],Values@clsts]];AppendTo[newVals,If[clrs===Nothing,Nothing,AssociationThread[newVals[[1]],Values@clrs]]];newVals]
We make another visualization function, displayMove, which uses the previous clusters to draw arrows from the old means to the new means. We take an argument of previous clusters rather than previous means because the old cluster contents are already necessary for the algorithm to function, as you’ll see later in this essay.
A function that determines the old means, displays the current color-coded means and clusters, and draws arrows from the old means to the updated ones:
In[]:=
displayMove[mns_,clsts_,oldClsts_,clrs_]:=Module[{oldMns},oldMns=Keys@oldClsts;Show[display[mns,clsts,clrs],Graphics[Table[{clrs[mns[[n]]],PointSize[.025],Opacity[.25],Point@oldMns[[n]],Arrow[{oldMns[[n]],mns[[n]]}]},{n,Length@means}],Axes->True]]]
We update the means, clusters, and colors and display the movement of the means. Although we calculated the new first mean earlier, we can still pass that updated value through calcNewMeans -- the result will be the same mean that we already calculated.
Set means, clusters, and colors equal to the output of calcNewMeans and display the movement of the means:
In[]:=
{means,clusters,colors}=calcNewMeans[means,clusters,colors];Labeled[displayMove[means,clusters,oldClusters,colors],"Move All Means to the Averages of Their Clusters",Top]
Out[]=
Move All Means to the Averages of Their Clusters |
 |
Now that we have a new set of k means, we can start the process all over again! Based on our updated means, we cluster the data points into new clusters, regardless of their previous cluster.
Cluster the points based on the new means and display the results:
In[]:=
clusters=clusterAll[means,points];Labeled[display[means,clusters,colors],"Cluster All",Top]
Out[]=
Cluster All |
Assembling the algorithm
Assembling the algorithm
We assemble the entire algorithm into a single function. Given a set of points and a number k with a default of 3, we create random means and alternate between clustering points and calculating new means until no more points move between clusters. At the end, we return the final means, clusters, and visualizations.
A function that calculates k means and clusters and a list of Graphics objects depicting the progression of the algorithm:
In[]:=
kMeansViz[points_,k_:3]:=Module[{means,clusters,oldClusters,colors,viz={}},means=RandomReal[{0,1},{k,2}];colors=AssociationThread[means,Join[{Red,Blue,Darker@Green,Orange},If[k>4,Darker@RandomColor[k-4],{}]][[;;k]]];clusters=clusterAll[means,points];AppendTo[viz,Labeled[display[means,clusters,colors],"Clusters at"<>ToString@NumberForm[means,3]]];While[!clusters===oldClusters,oldClusters=clusters;{means,clusters,colors}=calcNewMeans[means,clusters,colors];AppendTo[viz,Labeled[displayMove[means,clusters,oldClusters,colors],"Moving to"<>ToString@NumberForm[means,3]]];clusters=clusterAll[means,points];AppendTo[viz,Labeled[display[means,clusters,colors],"Clusters at"<>ToString@NumberForm[means,3]]];];{means,clusters,viz}]
Let’s test it out! We run kMeansViz on our initial data set to get resultsViz, a list of the final means, clusters, and visualizations.
Run the k-means algorithm on our points, print the final means, and visualize the progression of the algorithm:
In[]:=
resultsViz=kMeansViz[points];Print["Final means: "<>ToString@resultsViz[[1]]]Animate[Show@x,{x,resultsViz[[3]]},AnimationRunningFalse,AnimationRate1]
Final means: {{0.355828, 0.160408}, {0.195054, 0.777672}, {0.748813, 0.6068}}
Out[]=
| ||
|
We also can make a k-means function without visualization of the process in case we only want the resulting means and clusters.
A function that calculates k means and clusters given a list of points:
In[]:=
kMeans[points_,k_:3]:=Module[{means,clusters,oldClusters},means=RandomReal[{0,1},{k,Length@points[[1]]}];clusters=clusterAll[means,points];While[!clusters===oldClusters,oldClusters=clusters;{means,clusters}=calcNewMeans[means,clusters];clusters=clusterAll[means,points];];{means,clusters}]
After testing out our new kMeans function, we print the final means and display the results using our display function.
Set results equal to the output of kMeans, print the final means, and visualize the color-coded clusters:
In[]:=
results=kMeans[points];Print["Final means: "<>ToString@results[[1]]]display[results[[1]],results[[2]],AssociationThread[results[[1]],{Red,Blue,Darker@Green}]]
Final means: {{0.748813, 0.6068}, {0.195054, 0.777672}, {0.355828, 0.160408}}
Out[]=
Because we used k as an optional argument in both our kMeans and kMeansViz functions, we can easily try the algorithm with another value of k. Let’s try it with k = 4.
Run the k-means algorithm on points with a second argument of 4, print the final means, and display the clusters:
In[]:=
results=kMeans[points,4];Print["Final means: "<>ToString@results[[1]]]display[results[[1]],results[[2]],AssociationThread[results[[1]],{Red,Blue,Darker@Green,Orange}]]
Final means: {{0.195054, 0.777672}, {0.800397, 0.725523}, {0.258663, 0.142019}, {0.629081, 0.334349}}
Out[]=
Compare with FindClusters
Compare with FindClusters
The FindClusters function in the Wolfram Language takes KMeans as a Method option. Let’s compare FindClusters to our k-means algorithm.
In[]:=
results=kMeans[points,3];Labeled[display[results[[1]],results[[2]],AssociationThread[results[[1]],{Red,Blue,Darker@Green}]],Text@"Clusters Using Our kMeans Function",Top]
Out[]=
Clusters Using Our kMeans Function |
Use FindClusters to find three means using the KMeans method and visualize the results:
In[]:=
wlClusters=FindClusters[points,3,Method"KMeans"];Graphics[{PointSize[.01],Table[{{Red,Blue,Darker@Green}[[n]],Point/@wlClusters[[n]]},{n,3}]},AxesTrue,PlotLabel"Clusters Using FindClusters with the KMeans Method"]
Out[]=

These clusters seem to be identical! We can check out the centers of the clusters to be extra sure. FindClusters doesn’t return the average values of each cluster, so we can calculate those here.
In[]:=
wlMeans=Mean/@wlClusters
Out[]=
{{0.355828,0.160408},{0.195054,0.777672},{0.748813,0.6068}}
Let’s compare them with our kMeans results. We can’t use Equals on the two Lists because the order might be different depending on the initial means, so we’ll check that the Union of the two has exactly three objects.
In[]:=
Length@Union[wlMeans,results[[1]]]3
Out[]=
True
Cool! We’ve verified that our kMeans function generates the same output as FindClusters using the KMeans Method option.
Conclusion
Conclusion
The k-means algorithm is a fast, simple iterative approach to calculate multiple means and clusters within a data set. In this essay, we examined the process of identifying k means and clusters and compared our results with the results from FindClusters with the KMeans method.
Further reading
Further reading
Cite this as: Laney Moy, "The k-means algorithm" from the Notebook Archive (2020), https://notebookarchive.org/2020-10-0ikidvb
Download
