Wolfram Summer Camp 2018: Determining Sentiment of Emojis using
Author
Jacob Frances
Title
Wolfram Summer Camp 2018: Determining Sentiment of Emojis using
Description
Wolfram Summer Camp 2018: Determining Sentiment of Emojis using
Category
Essays, Posts & Presentations
Keywords
Wolfram Summer Camp 2018
URL
http://www.notebookarchive.org/2018-12-53xco1s/
DOI
https://notebookarchive.org/2018-12-53xco1s
Date Added
2018-12-11
Date Last Modified
2018-12-11
File Size
1.61 megabytes
Supplements
Rights
Redistribution rights reserved

WOLFRAM SUMMER CAMP 2018
Last modified on: Monday, July 9, 2018 at 15:03
Author Info
Name:
Jacob Frances
Mentor:
Rick Hennigan
End of Camp Presentation Content
Title of project:
Determining Sentiment of Emojis using
Goal of the project:
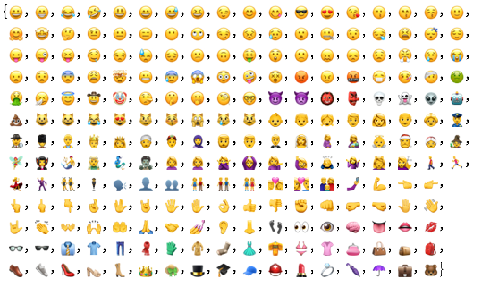
The goal of this project is to see how emojis are used within social media such as Twitter. The project will give an overarching sentiment of each emoji by classifying the sentiment of over 25,000
Add the most representative image of your project here. (We recommend just 1 image, if you add more, we will make a collage of the images.)
Image:


Summary of Results:
Findings in the data
- The emoji “ ” was the most negative, followed by “
 ” and “
 ”
”
- The most positive included “ ”, “
”, “ ”, “
”, “ ”
”
- Analysis of 97 emojis, pulling 250 tweets per emoji, however many more work
- The emoji “
- The most positive included “
- Analysis of 97 emojis, pulling 250 tweets per emoji, however many more work
Future work:
- Extend to other emojis
- Using the data from each emoji, determine sarcasm using statistical significance
- Represent emojis with large neutral count more effectively
- Using the data from each emoji, determine sarcasm using statistical significance
- Represent emojis with large neutral count more effectively
Additional Code Content
TwitterBarChart[data_,terms_]:=Module[{assocMap={"Positive"1,"Negative"-1,"Neutral"0}},BarChart[Sort[Total/@ReplaceAll[data,assocMap]],ChartLabelsPlaced[terms,Above]]]
Note: Everything above this bar is in your 2 minute presentation. Make sure it fits on 2 slides.
Preview Presentation
Detailed Project Notes
Main Results in Detail
Main Results in Detail
I found a general trend with positive looking emojis having a general positive sentiment, however, there were a few emojis that went completely against expectation. While some don’t follow this general trend, many have their own unique sentiment that doesn’t follow what one might expect, but instead how society uses it.
Code
Code
ShowAssociation[data_,terms_]:=Module[{counts=KeySort/@Counts/@data},Association[MapThread[Rule,{terms,counts}]]]GetSentiment[tweets_]:=Module[{sentimentList},sentimentList=Classify["Sentiment",#]&/@tweets;sentimentList=Delete[sentimentList,Position[sentimentList,Indeterminate]];Return[sentimentList]]SortEmojis[data_,emojis_]:=Module[{termsList,dataOrdering,assocMap={"Positive"1,"Negative"-1,"Neutral"0}},dataOrdering=Ordering[Total/@ReplaceAll[data,assocMap]];termsList=emojis[[dataOrdering]];Return[termsList]]GetTweetData[terms_,n_]:=Module[{sentimentList},sentimentList=Classify["Sentiment",#]&/@Normal[twitter["TweetSearch","Query"#,MaxItemsn][All,"Text"]]&/@terms;sentimentList=Delete[sentimentList,Position[sentimentList,Indeterminate]];Return[sentimentList]]TwitterDataSet[data_,terms_]:=Module[{counts=KeySort/@Counts/@data},Dataset[Association[MapThread[Rule,{terms,counts}]]]](*BarChart[Total/@ReplaceAll[data,assocMap]],,Dataset[Association[MapThread[Rule,{terms,counts}]]]*)TwitterPieCharts[data_,terms_]:=Module[{counts=KeySort/@Counts/@data},Thread[Labeled[PieChart[#,ChartLabels{"Negative","Neutral","Positive"}]&/@counts,terms]]]TwitterBarChart[data_,terms_]:=Module[{assocMap={"Positive"1,"Negative"-1,"Neutral"0}},BarChart[Sort[Total/@ReplaceAll[data,assocMap]],ChartLabelsPlaced[terms,Above]]]
Additional Text Content
Additional Text Content
Conclusions in Detail
Conclusions in Detail
Social use of Emojis on Twitter in some cases varies vastly from what we may expect in some case scenarios. There are some emojis that have vastly different “net sentiments” than they appear to have. However, with this in mind, one point of failure in the project was on Twitter’s end with their API. Twitter’s api is what is used in service connect to enable these features in the Wolfram Language, however this API pulls repeated tweets that are retweets often, giving tweets with more retweets more “weight” than a single tweet. This could be a potential source of bias within the data, and is something that could be improved upon later.
All Visualizations
All Visualizations


Data Sources Links/References
Data Sources Links/References
twitter.com
developer.twitter.com
developer.twitter.com
Background Info Links/References
Background Info Links/References
◼
◼
Keywords
Keywords
Provide keywords as items
◼
Twitter
◼
Sentiment Analysis
Other information
Other information
Cite this as: Jacob Frances, "Wolfram Summer Camp 2018: Determining Sentiment of Emojis using" from the Notebook Archive (2018), https://notebookarchive.org/2018-12-53xco1s
Download
