Driver-Hall-Kemp plots and simulations
Author
Brian C. Hall
Title
Driver-Hall-Kemp plots and simulations
Description
Plots and simulations for the article "The Brown measure of the free multiplicative Brownian motion," by B. K. Driver, B. C. Hall, and T. Kemp
Category
Academic Articles & Supplements
Keywords
Brownian motion, random matrices, free probability, Brown measure
URL
http://www.notebookarchive.org/2019-05-bjnnq2h/
DOI
https://notebookarchive.org/2019-05-bjnnq2h
Date Added
2019-05-25
Date Last Modified
2019-05-25
File Size
53.37 megabytes
Supplements
Rights
CC BY 4.0

Plots and simulations for the paper “The Brown measure of the free multiplicative Brownian motion,” by Bruce K. Driver, Brian C. Hall, and Todd Kemp
This notebook contains the Mathematica code for all the plots and simulations in the paper. No attempt here is made to explain the notation; for that, please see the paper, available on the arXiv as arXiv:1903.11015 [math.PR].
The following command will not work until after the simulations below have been executed. But after you run the simulations the first time--and execute the “Export” command at the end of the block of simulations--then the next time you open the file, you can just import the lists of eigenvalues without rerunning the simulations. That way, you can edit the plots without having to run all the simulations each time.
The following command will not work until after the simulations below have been executed. But after you run the simulations the first time--and execute the “Export” command at the end of the block of simulations--then the next time you open the file, you can just import the lists of eigenvalues without rerunning the simulations. That way, you can edit the plots without having to run all the simulations each time.
{a200,a350,a4,a410,a7}=Import["eigenvalues.mx"];
Defining some basic functions
Now we define the functions and and that are used in various places.
Defining some basic functions
Now we define the functions
f
t
T
h
In[]:=
Clear[t]Clear[a]Clear[b]Clear[z]f[t_,z_]:=z*Exp[(t/2)(1+z)/(1-z)]f[t,z]T[a_,b_]:=((a-1)^2+b^2)*Log[a^2+b^2]/(a^2+b^2-1)T[a,b]Clear[h]h[r_]:=r*Log[r^2]/(r^2-1)h[r]
Out[]=
t(1+z)
2(1-z)
Out[]=
(+)Log[+]
2
(-1+a)
2
b
2
a
2
b
-1++
2
a
2
b
Out[]=
rLog[]
2
r
-1+
2
r
Simulations
We start with simulations of the Brownian motion in GL(N;C). All simulations use and 200 steps in the time interval. Since the symbol “N” in Mathematica is reserved, we use for the size of the matrices. To simulate the Brownian motion, we multiply together a bunch of matrices of the form , for some small constant . In this special case, no Ito correction term is needed. On a fairly fast MacBook Pro, each simulations takes 3-4 minutes to run.
We start with simulations of the Brownian motion in GL(N;C). All simulations use
N=2,000
M
I+c(GUE)
c
+++ +++
t=2
In[]:=
M=2000;t=2.0;k=200;B200=IdentityMatrix[M];For[i=1,i<k+1,i++,B200=(IdentityMatrix[M]+RandomVariate[GaussianUnitaryMatrixDistribution[Sqrt[t]/Sqrt[2*k*M],M]]+*RandomVariate[GaussianUnitaryMatrixDistribution[Sqrt[t]/Sqrt[2*k*M],M]]).B200]a200=Eigenvalues[B200];Clear[t];
In[]:=
t=2.0;M=2000;g1=RegionPlot[T[x,y]<t,{x,-4,13},{y,-8.5,8.5},PlotPoints200,PlotStyle{Opacity[0],White},BoundaryStyleBlack,AspectRatio1];g2=ListPlot[Table[{Re[a200[[n]]],Im[a200[[n]]]},{n,1,M}],AspectRatio1,PlotRange{{-3,13},{-8.5,8.5}},AxesFalse,FrameTrue];evals20=Show[{g2,g1}]g5=ListPlot[Table[{Log[Abs[a200[[n]]]],Arg[a200[[n]]]},{n,1,M}],PlotRange{{-2,2},{-2,2}},AspectRatioTrue,AxesFalse,FrameTrue];q[w_]:=Exp[w]g6=RegionPlot[T[Re[q[x+*y]],Im[q[x+*y]]]<t,{x,-2,2},{y,-2,2},PlotPoints200,PlotStyle{Opacity[0],White},BoundaryStyleBlack,AspectRatio1];logs20=Show[{g5,g6}]Clear[t]
Out[]=

Out[]=

+++ +++
t=3.5
M=2000;t=3.5;k=200;B350=IdentityMatrix[M];For[i=1,i<k+1,i++,B350=(IdentityMatrix[M]+RandomVariate[GaussianUnitaryMatrixDistribution[Sqrt[t]/Sqrt[2*k*M],M]]+*RandomVariate[GaussianUnitaryMatrixDistribution[Sqrt[t]/Sqrt[2*k*M],M]]).B350]a350=Eigenvalues[B350];Clear[t];
In[]:=
t=3.5;M=2000;g1=RegionPlot[T[x,y]<t,{x,-3,11},{y,-7,7},PlotPoints200,PlotStyle{Opacity[0],White},BoundaryStyleBlack,AspectRatioTrue];g2=ListPlot[Table[{Re[a350[[n]]],Im[a350[[n]]]},{n,1,M}],AspectRatioTrue,PlotRange{{-3,11},{-7,7}},AxesFalse,FrameTrue];evals35=Show[{g2,g1}]g5=ListPlot[Table[{Log[Abs[a350[[n]]]],Arg[a350[[n]]]},{n,1,M}],PlotRange{{-Pi,Pi},{-Pi,Pi}},AspectRatioTrue,AxesFalse,FrameTrue];q[w_]:=Exp[w]g6=RegionPlot[T[Re[q[x+*y]],Im[q[x+*y]]]<t,{x,-Pi,Pi},{y,-Pi,Pi},PlotPoints200,PlotStyle{Opacity[0],White},BoundaryStyleBlack,AspectRatio1];logs35=Show[{g5,g6}]Clear[t]
Out[]=

Out[]=

+++ +++
t=4
M=2000;t=4;k=200;B4=IdentityMatrix[M];For[i=1,i<k+1,i++,B4=(IdentityMatrix[M]+RandomVariate[GaussianUnitaryMatrixDistribution[Sqrt[t]/Sqrt[2*k*M],M]]+*RandomVariate[GaussianUnitaryMatrixDistribution[Sqrt[t]/Sqrt[2*k*M],M]]).B4]a4=Eigenvalues[B4];Clear[t];
In[]:=
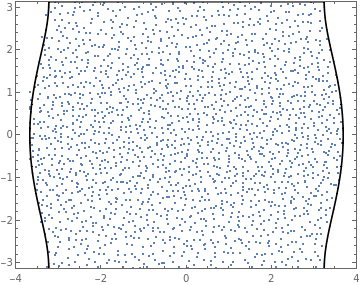
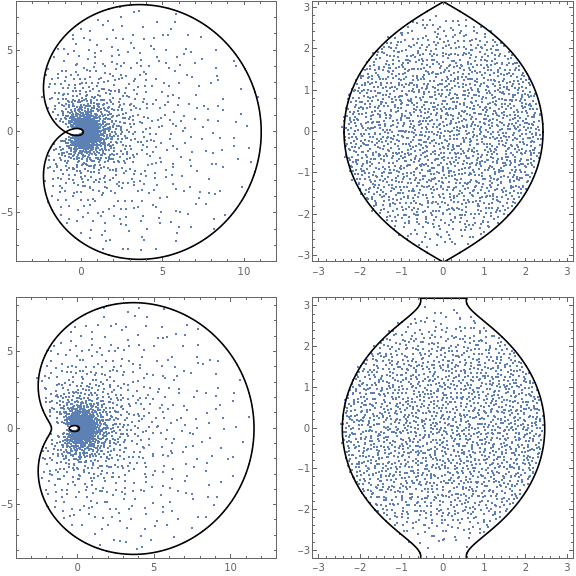
t=4;M=2000;g1=RegionPlot[T[x,y]<t,{x,-4,12},{y,-8,8},PlotPoints200,PlotStyle{Opacity[0],White},BoundaryStyleBlack,AspectRatio1];g2=ListPlot[Table[{Re[a4[[n]]],Im[a4[[n]]]},{n,1,M}],AspectRatio1,PlotRange{{-4,12},{-8,8}},AxesFalse,FrameTrue];evals40=Show[{g2,g1}]g3=ListPlot[Table[{Log[Abs[a4[[n]]]],Arg[a4[[n]]]},{n,1,M}],PlotRange{{-Pi,Pi},{-Pi,Pi}},AspectRatio1,AxesFalse,FrameTrue];q[w_]:=Exp[w]g4=RegionPlot[T[Re[q[x+*y]],Im[q[x+*y]]]<t,{x,-Pi,Pi},{y,-3.2,3.2},PlotPoints200,PlotStyle{Opacity[0],White},BoundaryStyleBlack,AspectRatio1,FrameTicks{{None,{-Pi,-Pi/2,0,Pi/2,Pi}},{Automatic,None}}];logs40=Show[{g3,g4}]Clear[t]
Out[]=

Out[]=

+++ +++
t=4.1
M=2000;t=4.1;k=200;B410=IdentityMatrix[M];For[i=1,i<k+1,i++,B410=(IdentityMatrix[M]+RandomVariate[GaussianUnitaryMatrixDistribution[Sqrt[t]/Sqrt[2*k*M],M]]+*RandomVariate[GaussianUnitaryMatrixDistribution[Sqrt[t]/Sqrt[2*k*M],M]]).B410]a410=Eigenvalues[B410];Clear[t];
In[]:=
t=4.1;M=2000;g1=RegionPlot[T[x,y]<t,{x,-4,13},{y,-8.5,8.5},PlotPoints200,PlotStyle{Opacity[0],White},BoundaryStyleBlack,AspectRatio1];g2=ListPlot[Table[{Re[a410[[n]]],Im[a410[[n]]]},{n,1,M}],AspectRatio1,PlotRange{{-4,13},{-8.5,8.5}},AxesFalse,FrameTrue];evals41=Show[{g2,g1}]g3=ListPlot[Table[{Log[Abs[a410[[n]]]],Arg[a410[[n]]]},{n,1,M}],PlotRange{{-Pi,Pi},{-3.2,3.2}},AspectRatio1,AxesFalse,FrameTrue];q[w_]:=Exp[w]g4=RegionPlot[T[Re[q[x+*y]],Im[q[x+*y]]]<t,{x,-Pi,Pi},{y,-3.2,3.2},PlotPoints200,PlotStyle{Opacity[0],White},BoundaryStyleBlack,AspectRatio1,FrameTicks{{None,{-Pi,-Pi/2,0,Pi/2,Pi}},{Automatic,None}}];logs41=Show[{g3,g4}]Clear[t]
Out[]=

Out[]=

+++ +++
t=7
M=2000;t=7;k=400;B7=IdentityMatrix[M];For[i=1,i<k+1,i++,B7=(IdentityMatrix[M]+RandomVariate[GaussianUnitaryMatrixDistribution[Sqrt[t]/Sqrt[2*k*M],M]]+*RandomVariate[GaussianUnitaryMatrixDistribution[Sqrt[t]/Sqrt[2*k*M],M]]).B7]a7=Eigenvalues[B7];Clear[t];
In[]:=
t=7;M=2000;g1=RegionPlot[T[x,y]<t,{x,-28,42},{y,-35,35},PlotPoints200,PlotStyle{Opacity[0],White},BoundaryStyleBlack,AspectRatioTrue];g2=ListPlot[Table[{Re[a7[[n]]],Im[a7[[n]]]},{n,1,M}],AspectRatioTrue,PlotRange{{-28,42},{-35,35}},AxesFalse,FrameTrue];evals70=Show[{g2,g1}]g5=ListPlot[Table[{Log[Abs[a7[[n]]]],Arg[a7[[n]]]},{n,1,M}],PlotRange{{-4,4},{-Pi,Pi}},AspectRatioPi/4,AxesFalse,FrameTrue];q[w_]:=Exp[w]g6=RegionPlot[T[Re[q[x+*y]],Im[q[x+*y]]]<t,{x,-4,4},{y,-Pi,Pi},PlotPoints200,PlotStyle{Opacity[0],White},BoundaryStyleBlack,AspectRatioPi/4];logs70=Show[{g5,g6}]Clear[t]
Out[]=

Out[]=
In[]:=
GraphicsGrid[{{evals40,logs40},{evals41,logs41}},ImageSizeLarge]
Out[]=
This export command puts a file into your default directory containing the data for the eigenvalues of the five simulations.
Export["eigenvalues.mx",{a200,a350,a4,a410,a7},"MX"]
End simulations
But don’t forget to run the “Export” command above!
But don’t forget to run the “Export” command above!
Plots of the regions
Σ
t
We now plot the region , computed as the set where .
Σ
t
T[x,y]<t
t3Region=RegionPlot[T[x,y]<3,{x,-4,13},{y,-8.5,8.5},PlotPoints60,AxesFalse,PlotStyleLightGray,BoundaryStyleBlack,Epilog{Dashed,Circle[{0,0},1]}];t41Region=RegionPlot[T[x,y]<4.1,{x,-4,13},{y,-8.5,8.5},PlotPoints150,AxesFalse,PlotStyleLightGray,BoundaryStyleBlack,Epilog{Dashed,Circle[{0,0},1]}];regionsFig=GraphicsRow[{t3Region,t41Region},ImageSizeLarge]

In plot below, the image on the right comes out of GraphicsRow smaller than the one on the left. But we can resize either image by clicking to select and then dragging the boxes on the edges. It seems to work well to select the first image and reduce it by dragging first the top and then the bottom.
t4region=RegionPlot[T[x,y]<4,{x,-4,12},{y,-8,8},PlotStyleLightGray,BoundaryStyleBlack,PlotPoints60];t4detail=RegionPlot[T[x,y]<4,{x,-1.6,0.6},{y,-1.1,1.1},PlotRange{{-1.5,0.5},{-1,1}},PlotStyleLightGray,BoundaryStyleBlack,PlotPoints60,FrameTicksAutomatic];t4regionFig=GraphicsRow[{t4region,t4detail},ImageSizeLarge]

Illustration of the definition of (θ).
r
t
t=1.5;rr=5.4;θmax=ArcCos[1-t/2];θmax/Pir2=2.21;θ=Pi/3;rr=0.12;r1r2fig=RegionPlot(x^2+y^2<1&&Abs[f[t,x+*y]]≥1)||(x^2+y^2>1&&Abs[f[t,x+*y]]≤1),{x,-0.4,4},{y,-2.2,2.2},PlotPoints100,AspectRatio1,AxesTrue,FrameFalse,PlotStyleLightGray,BoundaryStyleBlack,EpilogDisk[{r2*Cos[θ],r2*Sin[θ]},0.3rr],Disk[{(1/r2)*Cos[θ],(1/r2)*Sin[θ]},0.3rr],Text["θ",{1.0,0.5}],Text"(θ)",{1.02,1.3},Arrow[{{Cos[0.98*θ],0.997Sin[0.98*θ]},{Cos[θ],Sin[θ]}}],Thickness[0.0025],Circle[{r2*Cos[θ],r2*Sin[θ]},rr],Circle[{(1/r2)*Cos[θ],(1/r2)*Sin[θ]},rr],Circle[{0,0},1,{0,0.99θ}],Thickness[0.0035],Line[{{0,0},{r2*Cos[θ],r2*Sin[θ]}}]Clear[θ]
r
t
0.419569

Here is a plot of the function . It is better to use SliceContourPlot3D rather than Plot3D, so that we can draw the level curves on the graph, which show the regions. The syntax means that we draw the level curves of on top of the plot of the surface . It is good to set PlotPoints fairly high, but too high and the system seems to hang.
T[x,y]
T[x,y]
z=T[x,y]
SliceContourPlot3D[T[x,y],zT[x,y],{x,-3,13},{y,-8,8},{z,0,5},PlotPoints120,ViewPoint{0,-5.5,6},AxesEdge{{1,1},{-1,1},{-1,-1}}]
Now level curves of as a 2D plot.
T[x,y]
g1=ContourPlot[{T[a,b]3.7,T[a,b]4,T[a,b]==4.3},{a,-5,15},{b,-10,10},PlotPoints50,PlotRangePaddingNone,ContourStyle{Gray,Black,{Black,Dashed}}];g2=ContourPlot[{T[a,b]3.7,T[a,b]4,T[a,b]==4.3},{a,-1.5,0.5},{b,-1,1},PlotPoints50,PlotRangePaddingNone,ContourStyle{Gray,Black,{Black,Dashed}}];LevelSetsFig=GraphicsRow[{g1,g2},ImageSizeLarge]
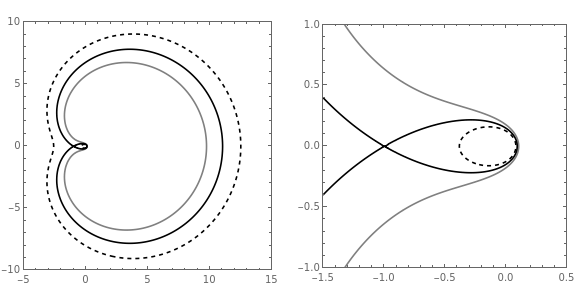
Illustration of the maximum value of θ.
rr=5.4;t=2.8;θmax=ArcCos[1-t/2];Rad=4;thetaMaxFig=RegionPlot[T[x,y]<2.8,{x,-2,7},{y,-4.5,4.5},PlotPoints60,AxesTrue,PlotStyleLightGray,BoundaryStyleBlack,FrameFalse,Epilog{Circle[{0,0},1],Circle[{0,0},Rad,{0,θmax}],Disk[{Cos[θmax],Sin[θmax]},0.1],Arrow[{{Rad*Cos[0.99θmax],Rad*Sin[0.99θmax]},{Rad*Cos[θmax],Rad*Sin[θmax]}}],Line[{{0,0},{rr*Cos[θmax],rr*Sin[θmax]}}],Line[{{0,0},{rr*Cos[θmax],-rr*Sin[θmax]}}],Text["(1-t/2)",{-0.2,4.3}]}]
-1
cos

Plots for Figure 18.
t=1.3;θ=ArcCos[1-t/2]setFtFig=RegionPlot[(x^2+y^2<1&&Abs[f[t,x+*y]]≥1)||(x^2+y^2>1&&Abs[f[t,x+*y]]≤1),{x,0,3.6},{y,-1.8,1.8},PlotPoints50,AxesTrue,FrameFalse,PlotStyleWhite,BoundaryStyleBlack,Epilog{Circle[{Cos[θ],Sin[θ]},0.05],Circle[{Cos[θ],-Sin[θ]},0.05],Dashed,Circle[{0,0},1],White,Disk[{Cos[θ],Sin[θ]},0.05],Disk[{Cos[θ],-Sin[θ]},0.05]},Ticks0,Cos[θ],"1-t/2",1,2,3,4,{-1,0,1.0}]Clear[t]Clear[θ]
1.21323

Plots of the density (θ) and related constructs
w
t
We now compute the density function ω, which I denote here by .
density[r,θ]
In[]:=
Clear[α]Clear[β]Clear[h]Clear[c]Clear[density]Clear[t]Clear[θ]h[r_]:=r*Log[r^2]/(r^2-1)c[r_]:=(1-h[r])/(r-1)^2α[r_]:=1-(r^2+1)c[r]β[r_]:=1+2r*c[r]ww[r_,θ_]:=1+h[r](α[r]+β[r]*Cos[θ])/(β[r]+α[r]*Cos[θ])density[r_,θ_]:=(1/(2π*t))*ww[r,θ]
Now plotting .
ω
t=2;θmax=ArcCos[1-t/2];n=200;rTable=Table[r/.FindRoot[Abs[f[t,r*Exp[*((k-1)/(n-1))θmax]]]1,{r,0.08}],{k,1,n}];rt=Interpolation[Table[{((k-1)/(n-1))θmax,rTable[[k]]},{k,1,n}]];view={-4,-3.5,2};g1=Plot3D[ww[Sqrt[x^2+y^2],Arg[x+*y]],{x,-0.5,5},{y,-3,3},ExclusionsNone,PlotPoints200,PlotRange{{-0.5,5},{-3,3},{1.4,2}},ViewPointview,BoxedFalse,Axes{True,True,False},AxesEdge{{-1,-1},{-1,-1},{-1,-1}}];g2=ParametricPlot3D[{{rt[Abs[θ]]*Cos[θ],rt[Abs[θ]]*Sin[θ],ww[rt[Abs[θ]],θ]},{(1/rt[Abs[θ]])*Cos[θ],(1/rt[Abs[θ]])*Sin[θ],ww[rt[Abs[θ]],θ]}},{θ,-θmax,θmax},PlotRange{{-0.5,5},{-3,3},{1.4,2}},PlotStyleBlack,ViewPointview,BoxedFalse,Axes{True,True,False},AxesEdge{{-1,-1},{-1,-1},{-1,-1}},ExclusionsNone,PlotPoints200];Show[{g1,g2}]
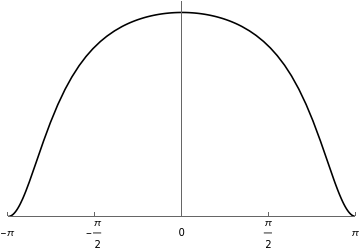
I now consider several times, namely . For each time, I compute and plot: (a) the function (θ), (b) the density (θ), (c) a histogram of plotted against Biane’s density. Here maps to the circle, defined to agree with on the boundary and to be independent of . It can be computed as an explicit function of .(d) a histogram of plotted against the predicted density . In the last two plots, the continuous plot is scaled vertically by a factor that is chosen to make the continuous plot and the histogram line up as closely as possible.In the histograms for , we get better results if we specify the bins as covering the values to with a bin size of for some integer , which I currently have chosen to be 30.The examples with give an error from the FindRoot command at , when . But this error can be ignored.
t=2,3.5,4,7
r
t
w
t
F
t
λ
j
F
t
Σ
t
f
t
r
ϕ
t
arg(λ)
arg
λ
j
2log((θ))(θ)
r
t
w
t
t≥4
-π
π
2π/n
n
t≤4
θ
max
r=1
t=2;θmax=ArcCos[1-t/2];n=200;rTable=Table[r/.FindRoot[Abs[f[t,r*Exp[*((k-1)/(n-1))θmax]]]1,{r,0.08}],{k,1,n}];rt=Interpolation[Table[{((k-1)/(n-1))θmax,rTable[[k]]},{k,1,n}]];ϕt[θ_]:=θ+h[rt[Abs[θ]]]*Sin[θ]rPlot2=Plot[{1/rt[Abs[θ]],rt[Abs[θ]]},{θ,-θmax,θmax},PlotRange{{-Pi,Pi},{0,Automatic}},PlotStyle{Black,{Black,Dashed}},Ticks{{-Pi,-Pi/2,0,Pi/2,Pi},Automatic},Epilog{Dashed,Line[{{θmax,0},{θmax,2rt[θmax]}}],Line[{{-θmax,0},{-θmax,2rt[θmax]}}]}]densityPlot2=Plot[density[rt[Abs[θ]],θ],{θ,-0.98θmax,0.98θmax},PlotRange{{-Pi,Pi},{0,Automatic}},PlotStyleBlack,Ticks{{-Pi,-Pi/2,0,Pi/2,Pi},None},Epilog{Dashed,Line[{{θmax,0},{θmax,density[rt[θmax],θmax]}}],Line[{{-θmax,0},{-θmax,density[rt[θmax],θmax]}}]}]h1=Histogram[ϕt[Arg[a200]],30,PlotRange{{-Pi,Pi},All},Ticks{{-Pi,-Pi/2,0,Pi/2,Pi},None},Axes{True,False}];steps=600;ϕmax=(1/2)*Sqrt[t(4-t)]+ArcCos[1-t/2];χList=Table[z/.FindRoot[f[t,z]Exp[*(-ϕmax+2*k*ϕmax/steps)],{z,0}],{k,0,steps}];χReal=ListInterpolation[Re[χList],{-ϕmax,ϕmax}];χImag=ListInterpolation[Im[χList],{-ϕmax,ϕmax}];χ[θ_]:=χReal[θ]+*χImag[θ]υ[θ_]:=(1/(2Pi))(1-Abs[χ[θ]]^2)/Abs[1-χ[θ]]^2p1=Plot[400υ[θ],{θ,-ϕmax,ϕmax},PlotRangeAll,Ticks{{-Pi,-Pi/2,0,Pi/2,Pi},None},Axes{True,False},PlotStyleBlack];BianePlot2=Show[{h1,p1}]rhoTable=Table[-Log[r/.FindRoot[Abs[f[t,r*Exp[*((k-1)/(n-1))θmax]]]1,{r,0.08}]],{k,1,n}];rhoInterpolate=Interpolation[Table[{((k-1)/(n-1))θmax,rhoTable[[k]]},{k,1,n}]];g1=Plot[420rhoInterpolate[Abs[θ]]*density[rt[Abs[θ]],θ],{θ,-θmax,θmax},PlotRange{{-Pi,Pi},All},PlotStyleBlack,Ticks{{-Pi,-Pi/2,0,Pi/2,Pi},None},AspectRatio0.8];g2=Histogram[Arg[a200],{-θmax,θmax,2θmax/30},PlotRange{{-Pi,Pi},All},Ticks{{-Pi,-Pi/2,0,Pi/2,Pi},None},Axes{True,False}];hist2=Show[g2,g1]Clear[t]


t=3.5;θmax=ArcCos[1-t/2];θmax/Pin=200;rTable=Table[r/.FindRoot[Abs[f[t,r*Exp[*((k-1)/(n-1))θmax]]]1,{r,0.08}],{k,1,n}];rt=Interpolation[Table[{((k-1)/(n-1))θmax,rTable[[k]]},{k,1,n}]];ϕt[θ_]:=θ+h[rt[Abs[θ]]]*Sin[θ]rPlot35=Plot[{1/rt[Abs[θ]],rt[Abs[θ]]},{θ,-θmax,θmax},PlotRange{{-Pi,Pi},{0,Automatic}},PlotStyle{Black,{Black,Dashed}},Ticks{{-Pi,-Pi/2,0,Pi/2,Pi},Automatic},Epilog{Dashed,Line[{{θmax,0},{θmax,2rt[θmax]}}],Line[{{-θmax,0},{-θmax,2rt[θmax]}}]}]densityPlot35=Plot[{(2/t+UθInterpolate'[Abs[θ]])/(4Pi),density[rt[Abs[θ]],θ]},{θ,-θmax,θmax},PlotRange{{-Pi,Pi},{0,Automatic}},PlotStyleBlack,Ticks{{-Pi,-Pi/2,0,Pi/2,Pi},None},Epilog{Dashed,Line[{{θmax,0},{θmax,density[rt[θmax],θmax]}}],Line[{{-θmax,0},{-θmax,density[rt[θmax],θmax]}}]}]ϕmax=(1/2)*Sqrt[t(4-t)]+ArcCos[1-t/2];ϕmax/Pih1=Histogram[ϕt[Arg[a350]],{-ϕmax,ϕmax,2ϕmax/30},PlotRange{{-Pi,Pi},All},Ticks{{-Pi,-Pi/2,0,Pi/2,Pi},None},Axes{True,False}];steps=600;χList=Table[z/.FindRoot[f[t,z]Exp[*(-ϕmax+2*k*ϕmax/steps)],{z,0}],{k,0,steps}];χReal=ListInterpolation[Re[χList],{-ϕmax,ϕmax}];χImag=ListInterpolation[Im[χList],{-ϕmax,ϕmax}];χ[θ_]:=χReal[θ]+*χImag[θ]υ[θ_]:=(1/(2Pi))(1-Abs[χ[θ]]^2)/Abs[1-χ[θ]]^2p1=Plot[410υ[θ],{θ,-ϕmax,ϕmax},PlotRangeAll,Ticks{{-Pi,-Pi/2,0,Pi/2,Pi},None},Axes{True,False},PlotStyleBlack];BianePlot35=Show[{h1,p1}]rhoTable=Table[-Log[r/.FindRoot[Abs[f[t,r*Exp[*((k-1)/(n-1))θmax]]]1,{r,0.08}]],{k,1,n}];rhoInterpolate=Interpolation[Table[{((k-1)/(n-1))θmax,rhoTable[[k]]},{k,1,n}]];g1=Plot[645rhoInterpolate[Abs[θ]]*density[rt[Abs[θ]],θ],{θ,-θmax,θmax},PlotStyleBlack,Ticks{Automatic,None}];g2=Histogram[Arg[a350],{-θmax,θmax,2θmax/30},PlotRange{{-Pi,Pi},All},Ticks{{-Pi,-Pi/2,0,Pi/2,Pi},None},Axes{True,False}];hist35=Show[g2,g1]Clear[t]
0.769947


0.980489


t=4.0;θmax=ArcCos[1-t/2]n=200;rTable=Table[r/.FindRoot[Abs[f[t,r*Exp[*((k-1)/(n-1))θmax]]]1,{r,0.08}],{k,1,n}];rt=Interpolation[Table[{((k-1)/(n-1))θmax,rTable[[k]]},{k,1,n}]];ϕt[θ_]:=θ+h[rt[Abs[θ]]]*Sin[θ]rPlot4=Plot[{1/rt[Abs[θ]],rt[Abs[θ]]},{θ,-θmax,θmax},PlotRange{{-Pi,Pi},{0,Automatic}},PlotStyle{Black,{Black,Dashed}},Ticks{{-Pi,-Pi/2,0,Pi/2,Pi},Automatic}]densityPlot4=Plot[{density[rt[Abs[θ]],θ]},{θ,-θmax,θmax},PlotRange{{-Pi,Pi},{0,Automatic}},PlotStyleBlack,Ticks{{-Pi,-Pi/2,0,Pi/2,Pi},None},Epilog{Dashed,Line[{{θmax,0},{θmax,density[rt[θmax],θmax]}}],Line[{{-θmax,0},{-θmax,density[rt[θmax],θmax]}}]}]h1=Histogram[ϕt[Arg[a4]],{-Pi,Pi,2Pi/30},PlotRange{{-Pi,Pi},All},Ticks{{-Pi,-Pi/2,0,Pi/2,Pi},None},Axes{True,False}];steps=600;χList=Table[z/.FindRoot[f[t,z]Exp[*(-θmax+2*k*θmax/steps)],{z,0}],{k,0,steps}];χReal=ListInterpolation[Re[χList],{-θmax,θmax}];χImag=ListInterpolation[Im[χList],{-θmax,θmax}];χ[θ_]:=χReal[θ]+*χImag[θ]υ[θ_]:=(1/(2Pi))(1-Abs[χ[θ]]^2)/Abs[1-χ[θ]]^2p1=Plot[420υ[θ],{θ,-θmax,θmax},PlotRange{{-1.01Pi,1.01Pi},All},Ticks{{-Pi,-Pi/2,0,Pi/2,Pi},None},Axes{True,False},PlotStyleBlack];BianePlot4=Show[{h1,p1}]rhoTable=Table[-Log[r/.FindRoot[Abs[f[t,r*Exp[*((k-1)/(n-1))θmax]]]1,{r,0.08}]],{k,1,n}];rhoInterpolate=Interpolation[Table[{((k-1)/(n-1))θmax,rhoTable[[k]]},{k,1,n}]];g1=Plot[845rhoInterpolate[Abs[θ]]*density[rt[Abs[θ]],θ],{θ,-θmax,θmax},PlotStyleBlack,Ticks{{-Pi,-Pi/2,0,Pi/2,Pi},None}];g2=Histogram[Arg[a4],{-Pi,Pi,2Pi/30},PlotRange{{-θmax,θmax},All},Ticks{{-Pi,-Pi/2,0,Pi/2,Pi},None},Axes{True,False}];hist4=Show[g2,g1]Clear[t]
3.14159
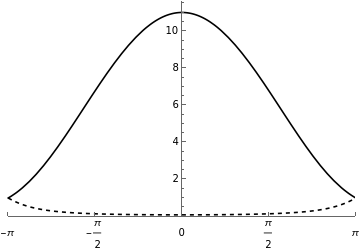
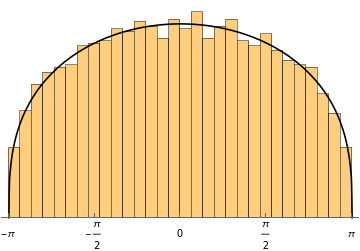

t=7.0;θmax=Pi;n=200;rTable=Table[r/.FindRoot[Abs[f[t,r*Exp[*((k-1)/(n-1))θmax]]]1,{r,0.08}],{k,1,n}];rt=Interpolation[Table[{((k-1)/(n-1))θmax,rTable[[k]]},{k,1,n}]];ϕt[θ_]:=θ+h[rt[Abs[θ]]]*Sin[θ]rPlot7=Plot[{1/rt[Abs[θ]],rt[Abs[θ]]+0.3},{θ,-θmax,θmax},PlotRange{{-Pi,Pi},{0,Automatic}},PlotStyle{Black,{Black,Dashed}},Ticks{{-Pi,-Pi/2,0,Pi/2,Pi},Automatic}]densityPlot7=Plot[{density[rt[Abs[θ]],θ]},{θ,-θmax,θmax},PlotRange{{-Pi,Pi},{0,Automatic}},PlotStyleBlack,Ticks{{-Pi,-Pi/2,0,Pi/2,Pi},None}]h1=Histogram[ϕt[Arg[a7]],{-Pi,Pi,2Pi/30},PlotRange{{-Pi,Pi},All},Ticks{{-Pi,-Pi/2,0,Pi/2,Pi},None},Axes{True,False}];steps=600;χList=Table[z/.FindRoot[f[t,z]Exp[*(-θmax+2*k*θmax/steps)],{z,0}],{k,0,steps}];χReal=ListInterpolation[Re[χList],{-θmax,θmax}];χImag=ListInterpolation[Im[χList],{-θmax,θmax}];χ[θ_]:=χReal[θ]+*χImag[θ]υ[θ_]:=(1/(2Pi))(1-Abs[χ[θ]]^2)/Abs[1-χ[θ]]^2p1=Plot[415υ[θ],{θ,-θmax,θmax},PlotRange{{-Pi,Pi},All},Ticks{{-Pi,-Pi/2,0,Pi/2,Pi},None},Axes{True,False},PlotStyleBlack];BianePlot7=Show[{h1,p1}]rhoTable=Table[-Log[r/.FindRoot[Abs[f[t,r*Exp[*((k-1)/(n-1))θmax]]]1,{r,0.08}]],{k,1,n}];rhoInterpolate=Interpolation[Table[{((k-1)/(n-1))θmax,rhoTable[[k]]},{k,1,n}]];g1=Plot[830rhoInterpolate[Abs[θ]]*density[rt[Abs[θ]],θ],{θ,-θmax,θmax},PlotStyleBlack,Ticks{Automatic,None}];g2=Histogram[Arg[a7],{-Pi,Pi,2Pi/30},PlotRange{{-θmax,θmax},All},Ticks{{-Pi,-Pi/2,0,Pi/2,Pi},None},Axes{True,False}];hist7=Show[g2,g1]Clear[t]


rPlotsFig=GraphicsGrid[{{rPlot2,rPlot35},{rPlot4,rPlot7}},ImageSizeLarge]VPlotsFig=GraphicsGrid[{{densityPlot2,densityPlot35},{densityPlot4,densityPlot7}},ImageSizeLarge]histogramsFig=GraphicsGrid[{{hist2,hist35},{hist4,hist7}},ImageSizeLarge]BianePlotsFig=GraphicsGrid[{{BianePlot2,BianePlot35},{BianePlot4,BianePlot7}},ImageSizeLarge]


Now I make 3D plots of the full density . Thus, I recompute (θ) and multiply by .
W
t
w
t
1/
2
r
In[]:=
Clear[t]W[a_,b_]:=Piecewise[{{-1,T[a,b]>t},{density[rt[Abs[Arg[a+*b]]],Abs[Arg[a+*b]]]/(a^2+b^2),T[a,b]<t}}]
Plot for . It helps to manually crop after plotting to remove white space above. (Select the image, hold down command key and then drag the boxes on the boundary.)
t=1
In[]:=
t=1.;θmax=ArcCos[1-t/2];n=200;rTable=Table[r/.FindRoot[Abs[f[t,r*Exp[*((k-1)/(n-1))θmax]]]1,{r,0.08}],{k,1,n}];rt=Interpolation[Table[{((k-1)/(n-1))θmax,rTable[[k]]},{k,1,n}]];g1=Plot3D[W[a,b],{a,0,3},{b,-1.5,1.5},PlotRange{0,All},Exclusions{T[a,b]t},PlotPoints200,BoxedFalse,Axes{True,True,False},AxesEdge{{-1,-1},{-1,-1},{-1,-1}},ViewPoint{-0.5,-2,0.5}]Clear[t]
Out[]=
Now , full plot and detail. It helps to manually crop after plotting to remove white space above. (Select the image, hold down command key and then drag the boxes on the boundary.)
t=4
In[]:=
t=4.;θmax=Pi;n=200;rTable=Table[r/.FindRoot[Abs[f[t,r*Exp[*((k-1)/(n-1))θmax]]]1,{r,0.08}],{k,1,n}];rt=Interpolation[Table[{((k-1)/(n-1))θmax,rTable[[k]]},{k,1,n}]];g1=Plot3D[W[a,b],{a,-3,13},{b,-8,8},PlotRange{0,30/(4Pi)},Exclusions{T[a,b]t},PlotPoints200,BoxedFalse,Axes{True,True,False},AxesEdge{{-1,-1},{-1,-1},{-1,-1}},ViewPoint{-0.5,-2,0.8}]g2=Plot3D[W[a,b],{a,-1.5,1.5},{b,-1.5,1.5},PlotRange{0,30/(4Pi)},ExclusionsNone,PlotPoints200,BoxedFalse,Axes{True,True,False},AxesEdge{{-1,-1},{-1,-1},{-1,-1}},ViewPoint{-0.5,-2,0.8}]Clear[t]
Out[]=
Out[]=
Plotting the function in Figure 10.
Φ
t
In[]:=
t=3;θmax=ArcCos[1-t/2];aa=0.07;ϕmax=(1/2)*Sqrt[t(4-t)]+ArcCos[1-t/2];n=1000;rTable=Table[r/.FindRoot[Abs[f[t,r*Exp[*((k-1)/(n-1))θmax]]]1,{r,0.08}],{k,1,n}];r=Interpolation[Table[{((k-1)/(n-1))θmax,rTable[[k]]},{k,1,n}]];g[a_,b_]:=2b/((a-1)^2+b^2)theta={0.5*Pi,0.4*Pi,0.32*Pi,0.25*Pi,0.17*Pi,0.075*Pi};cc=Table[g[r[theta[[i]]]*Cos[theta[[i]]],r[theta[[i]]]*Sin[theta[[i]]]],{i,1,6}];g1=RegionPlot[T[a,b]<t,{a,-2,8},{b,-5,5},PlotStyleLightGray,BoundaryStyleBlack,FrameTicksNone];g2=Graphics[{Thickness[0.005],Table[Line[{{r[theta[[i]]]*Cos[theta[[i]]],r[theta[[i]]]*Sin[theta[[i]]]},{(1/r[theta[[i]]])*Cos[theta[[i]]],(1/r[theta[[i]]])*Sin[theta[[i]]]}}],{i,1,6}],Table[Line[{{r[theta[[i]]]*Cos[theta[[i]]],-r[theta[[i]]]*Sin[theta[[i]]]},{(1/r[theta[[i]]])*Cos[theta[[i]]],-(1/r[theta[[i]]])*Sin[theta[[i]]]}}],{i,1,6}],Line[{{r[0],0},{(1/r[0]),0}}]},PlotRange{{-2,8},{-5,5}}];rad1=0.965;rad2=1.035;ff={0.5,1.0,1.3,1.8,2.3,2.8};g3=RegionPlot[((x^2+y^2<1+aa)&&(x^2+y^2>1-aa))&&((Arg[x+*y]<ϕmax)&&(Arg[x+*y]>-ϕmax)),{x,-1.3,1.3},{y,-1.3,1.3},FrameTicksNone,PlotPoints60,PlotStyleLightGray,BoundaryStyleBlack,PlotPoints60,Epilog{Thickness[0.007],Table[Line[{{rad1*Cos[ff[[i]]],rad1*Sin[ff[[i]]]},{rad2*Cos[ff[[i]]],rad2*Sin[ff[[i]]]}}],{i,1,6}],Line[{{rad1*Cos[0],rad1*Sin[0]},{rad2*Cos[0],rad2*Sin[0]}}],Table[Line[{{rad1*Cos[ff[[i]]],rad1*Sin[-ff[[i]]]},{rad2*Cos[ff[[i]]],rad2*Sin[-ff[[i]]]}}],{i,1,6}]}];LevelSetsSthetaFig=Show[{g1,g2}];GraphicsRow[{LevelSetsSthetaFig,g3},ImageSizeLarge]
Out[]=

Now a plot of against a 3D histogram of the eigenvalues. It helps to manually crop the image after plotting to remove white space on all four sides. (Select the image, hold down command key and then drag the boxes on the boundaries.)
W
t
In[]:=
t=2;θmax=ArcCos[1-t/2];n=200;rTable=Table[r/.FindRoot[Abs[f[t,r*Exp[*((k-1)/(n-1))θmax]]]1,{r,0.08}],{k,1,n}];rt=Interpolation[Table[{((k-1)/(n-1))θmax,rTable[[k]]},{k,1,n}]];g1=Plot3D[W[a,b],{a,-0.8,5.2},{b,-3,3},PlotRange{0,All},Exclusions{T[a,b]t},PlotPoints200,BoxedFalse,AxesFalse];g2=Histogram3D[Table[{Re[a200[[n]]],Im[a200[[n]]]},{n,1,2000}],{0.2},BoxedFalse,AxesFalse];GraphicsRow[{g1,g2},Scaled[-0.3],ImageSizeLarge]
Out[]=

Small- and large-time asymptotics
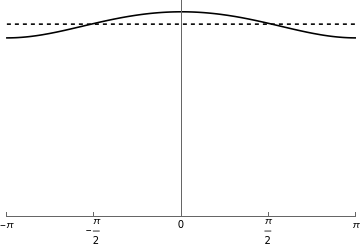
Here are some plots for Section 8.1, on the asymptotics of the density for small and large times.
Here are some plots for Section 8.1, on the asymptotics of the density for small and large times.
t=0.3;θmax=ArcCos[1-t/2];n=200;rTable=Table[r/.FindRoot[Abs[f[t,r*Exp[*((k-1)/(n-1))θmax]]]1,{r,0.5}],{k,1,n}];rt=Interpolation[Table[{((k-1)/(n-1))θmax,rTable[[k]]},{k,1,n}]];ϕt[θ_]:=θ+h[rt[Abs[θ]]]*Sin[θ]densityPlot03=Plot[{density[rt[Abs[θ]],θ],1/(Pi*t)},{θ,-θmax,θmax},PlotRange{{-Pi,Pi},{0,Automatic}},PlotStyle{Black,{Black,Dashed}},Ticks{{-Pi,-Pi/2,0,Pi/2,Pi},None},Epilog{Dashed,Line[{{θmax,0},{θmax,density[rt[θmax],θmax]}}],Line[{{-θmax,0},{-θmax,density[rt[θmax],θmax]}}]}]Clear[t]

t=1;θmax=ArcCos[1-t/2];n=200;rTable=Table[r/.FindRoot[Abs[f[t,r*Exp[*((k-1)/(n-1))θmax]]]1,{r,0.35}],{k,1,n}];rt=Interpolation[Table[{((k-1)/(n-1))θmax,rTable[[k]]},{k,1,n}]];ϕt[θ_]:=θ+h[rt[Abs[θ]]]*Sin[θ]densityPlot1=Plot[{density[rt[Abs[θ]],θ],1/(Pi*t)},{θ,-θmax,θmax},PlotRange{{-Pi,Pi},{0,Automatic}},PlotStyle{Black,{Black,Dashed}},Ticks{{-Pi,-Pi/2,0,Pi/2,Pi},None},Epilog{Dashed,Line[{{θmax,0},{θmax,density[rt[θmax],θmax]}}],Line[{{-θmax,0},{-θmax,density[rt[θmax],θmax]}}]}]

GraphicsRow[{densityPlot03,densityPlot1},ImageSizeLarge]

t=7.0;θmax=Pi;n=200;rTable=Table[r/.FindRoot[Abs[f[t,r*Exp[*((k-1)/(n-1))θmax]]]1,{r,0.08}],{k,1,n}];rt=Interpolation[Table[{((k-1)/(n-1))θmax,rTable[[k]]},{k,1,n}]];ϕt[θ_]:=θ+h[rt[Abs[θ]]]*Sin[θ]density7=Plot[{density[rt[Abs[θ]],θ],1/(2Pi*t)},{θ,-θmax,θmax},PlotRange{{-Pi,Pi},{0,Automatic}},PlotStyle{Black,{Black,Dashed}},Ticks{{-Pi,-Pi/2,0,Pi/2,Pi},None}]

t=10.0;θmax=Pi;n=200;rTable=Table[r/.FindRoot[Abs[f[t,r*Exp[*((k-1)/(n-1))θmax]]]1,{r,0.006}],{k,1,n}];rt=Interpolation[Table[{((k-1)/(n-1))θmax,rTable[[k]]},{k,1,n}]];ϕt[θ_]:=θ+h[rt[Abs[θ]]]*Sin[θ]density10=Plot[{density[rt[Abs[θ]],θ],1/(2Pi*t)},{θ,-θmax,θmax},PlotRange{{-Pi,Pi},{0,Automatic}},PlotStyle{Black,{Black,Dashed}},Ticks{{-Pi,-Pi/2,0,Pi/2,Pi},None}]
GraphicsRow[{density7,density10},ImageSizeLarge]

Cite this as: Brian C. Hall, "Driver-Hall-Kemp plots and simulations" from the Notebook Archive (2019), https://notebookarchive.org/2019-05-bjnnq2h
Download
