Visualizing Routing and Determining Optimal Paths
Author
Alice Liu
Title
Visualizing Routing and Determining Optimal Paths
Description
This project visualizes the information provided by traceroute and determines an optimal route based off of ping times to a given destination domain.
Category
Essays, Posts & Presentations
Keywords
network, router, graph, ping, visualization
URL
http://www.notebookarchive.org/2019-07-5k04kel/
DOI
https://notebookarchive.org/2019-07-5k04kel
Date Added
2019-07-12
Date Last Modified
2019-07-12
File Size
19.84 megabytes
Supplements
Rights
Redistribution rights reserved

Visualization of Traceroutes and Determining Optimal Paths
Visualization of Traceroutes and Determining Optimal Paths
Alice Liu
Mentor: Christian Pasquel
Mentor: Christian Pasquel
Project Description
Project Description
Routers connect computer networks together and send packets to the correct location. In computer networks, packets make multiple hops to different locations in order to reach their destination. The router determines how to send the packets based on the destination IP address. An IP address is an address that is assigned to each device connected to a computer network and allows for identification and communication. Public IP addresses have a geolocation associated with them that we can look up, although they are not always entirely accurate.
A routing algorithm is used in order to determine the path that will be taken in order to reach a destination effectively based on a variety of factors such as distance and network traffic. Our project uses the ping time—the round-trip time taken for a packet to go to and from your destination— in order to determine the optimal route.
This project finds the route traveled by a packet as it makes its way to a given domain. The traceroute command was used in order to gather this data on various websites from across the globe. We could extract information about how long it took to receive a response from the servers as well as the IPv4 addresses of where our packets went. This data was then cleaned and formatted for use in visualizing a map of the results. Furthermore, a graph was created based off of these results with the nodes set to the unique locations visited by the packets and the edges weighted by the average ping time. Based off of these ping times, I found optimal routes to destinations.
Summary of Results
Summary of Results
This project gave us a visualization of the routes of packets to many different websites, centered at our current location. Furthermore, we were able to successfully convert these routes into a graph which we could use a shortest path algorithm on in order to determine the optimal route a packet can travel through in order to arrive at its destination. Finding the shortest path returns a list of cities the packet would go through.
Important Functions
Important Functions
getRoute uses traceroute in order to get the hops a packet takes to arrive at a destination IP. It then formats it by index, times (ms), and IP address.
In[]:=
getRoute[domain_]:=rawoutput=RunProcess[{"tracert",domain}];formatted=StringSplit(StringSplit[rawoutput["StandardOutput"],"\r\n"][[4;;]]//StringTrim), " "" "" "" "" "[[;;-3]];associations=Table[AssociationThread[{"index","time1","time2","time3","ip"}Table[formatted[[m,n]],{n,1,5}]],{m,1,formatted//Length}];regexIPPattern="((25[0-5]|2[0-4][0-9]|[01]?[0-9][0-9]?)\\.(25[0-5]|2[0-4][0-9]|[01]?[0-9][0-9]?)\\.(25[0-5]|2[0-4][0-9]|[01]?[0-9][0-9]?)\\.(25[0-5]|2[0-4][0-9]|[01]?[0-9][0-9]?))";pingFormat=___~~DigitCharacter~~___~~" ms";Function[u,<|"Index"u["index"],"Time1"If[StringContainsQ[u["time1"],pingFormat],Quantity[First@StringCases[u["time1"],DigitCharacter..],"Milliseconds"],Missing["NotAvailable"]],"Time2"If[StringContainsQ[u["time2"],pingFormat],Quantity[First@StringCases[u["time2"],DigitCharacter..],"Milliseconds"],Missing["NotAvailable"]],"Time3"If[StringContainsQ[u["time3"],pingFormat],Quantity[First@StringCases[u["time3"],DigitCharacter..],"Milliseconds"],Missing["NotAvailable"]],"IP"With[{match=StringCases[u["ip"],RegularExpression[regexIPPattern]"$1"]},If[match==={},Missing["NotAvailable"],Entity["IPAddress",First[match]]]]|>]/@associations
cleanResults deletes requests that timed out or missing IP addresses.
In[]:=
cleanResults[resultVar_]:=Cases[#,<|"Index"_,"Time1"_Quantity,"Time2"_Quantity,"Time3"_Quantity,"IP"_Entity|>]&/@resultVar
GetLocationAndMeanTime gives us the geolocation of the IP address, which is not accurate and only an approximation, as well as the average ping time.
In[]:=
GetLocationAndMeanTime[results_]:=Function[v,{First[v],v〚2〛,Last[v]}]/@DeleteCasesFunctionu,Mean[ToExpression/@QuantityMagnitude[Take[u,3]]],u4,u4/@Lookup[#,{"Time1","Time2","Time3","IP"}],{_,_Missing,_}&/@results
host coordinates
GenerateElementGeoPaths and GenerateGeoPaths plot the many routes we have, given the locations and average ping times of the elements. We use a color scheme in order to give a visual indicator on the relative speed of ping times of different routes by having the color differ depending on the speed.
In[]:=
GenerateElementGeoPaths[locationAndMeansElement_,colorFunction_]:=Flatten[Function[v,Function[u,{{GeoMarker[u〚2,2〛,Graphics[Disk[]],"Scale"Scaled[0.015],"Color"colorFunction[u〚2,1〛]]},{Thickness[0.0008],colorFunction[u〚2,1〛],GeoPath[{u〚1,2〛,u〚2,2〛},"Geodesic"]}}]/@Partition[v,2,1]]/@locationAndMeansElement,1]
In[]:=
GenerateGeoPaths[locationAndMeans_,colorScheme_]:=Block[{minmax,colorFunc},minmax=MinMax[Flatten[locationAndMeans,2]〚All,1〛];colorFunc=ColorData[{colorScheme,minmax}];Flatten[GenerateElementGeoPaths[#,colorFunc]&/@locationAndMeans,1]]
generateGraphs generates a directed graph where the vertices are the cities located nearest to the geolocation of an IP Address and the edges are weighted by average ping times.
In[]:=
generateGraphs[locationAndMeans_]:=Block[{locations,pingTimes,uniqueLocations,locationstoNum},locations=(Flatten[locationAndMeans,1])[[All,All,2]];pingTimes=Flatten@(Rest/@(Flatten[locationAndMeans,1])[[All,All,1]]);uniqueLocations=DeleteDuplicates@(Flatten[(Flatten[locationAndMeans,1])[[All,All,2]],1]);locationstoNum=Table[First@Replace[locations[[m,n]],locations[[m,n]]First@Position[uniqueLocations,locations[[m,n]]]],{m,Length@locations},{n,Length@locations[[m]]}];nearestCities=Table[GeoNearest[Entity["City"],GeoPosition[uniqueLocations[[i]]]],{i,uniqueLocations//Length}];graphedRoutes=Graph[Flatten[Table[Table[locationstoNum[[a,b]]locationstoNum[[a,b+1]],{b,(locationstoNum[[a]]//Length)-1}],{a,locationstoNum//Length}]],EdgeWeightpingTimes,VertexLabelsTable[iPlaced[nearestCities[[i]],Top],{i,uniqueLocations//Length}],VertexLabelStyleDirective[White,9],VertexSize0.2,EdgeStyle{Directive[Green,Arrowheads[.008]],(11)Opacity[0.125]},BackgroundBlack]];
The Wolfram Language has many useful functions built in, such as FindShortestPath. This function takes in a website address and then returns the cities a packet passes through to get to its destination. We use the result given to us by FindShortestPath and then take the city in our list associated with each number it returns. The list of cities come from the data we have generated in the generateGraphs function based off of the data we have collected with the IP addresses and routing.
In[]:=
shortestPath[website_]:=Block[{destination,nearestCity,f},destination=GeoPosition[Entity["IPAddress",(First@First@HostLookup[website])]["HostCoordinates"]];nearestCity=First@GeoNearest[Flatten@nearestCities,destination];f[i_]:=(nearestCities)[[i]];Flatten@(f/@FindShortestPath[graphedRoutes,1,First@First@Position[Flatten@nearestCities,nearestCity]])]
The Code
The Code
Gathering our Data
Gathering our Data
The first step was gathering data. I found popular websites from around the world and performed traceroute on them in order to see how our packets will end up there and saved the results to a file. Any website or valid IP address can be used, but here is just what I used in the compilation of my data.
resultsA=getRoute/@{"labanquepostale.fr","lemonde.fr","lefigaro.fr","purepeople.com","marca.com","elmundo.es","elpais.com","milanucios.com","pasion.com","caixabank.es","mercadolibre.com.mx","caliente.mx","animeflv.net","unam.mx","www.gob.mx","commbank.com.au","bom.gov.au","seek.com.au","woolworths.com.au","carsales.com.au","google.ca","amazon.ca","kijiji.ca","cbc.ca","desjardins.ca","canada.ca","youm7.com","souq.com","masrawy.com","yallakora.com","filgoal.com","hkjc.com","lihkg.com","on.cc","discuss.com.hk","ulifestyle.com.hk","baidu.com","alibaba.com","taobao.com","qq.com","bilibili.com","google.com","youtube.com","facebook.com","amazon.com","yahoo.com","twitter.com","ebay.com","instagram.com","wikipedia.org","flipkart.com","cricbuzz.com","xbombo.com","indiatimes.com","news18.com","flipkart.com","cricbuzz.com","xbombo.com","indiatimes.com","news18.com","yad2.co.il","zap.co.il","bankhapoalim.co.il","newsru.co.il","sport5.co.il","afip.gob.ar","lanacion.com.ar","bbva.com.ar","bancogalicia.com.ar","hollywoodbets.net","tubidy.mobi","mtn.co.za","iol.co.za","uol.com.br","bet365.com","americanas.com.br","kooora.com","www.men.gov.ma"};Save["C:\\Users\\alice\\OneDrive\\Desktop\\Schoolwork\\Wolfram Camp\\Project\\.GlobalResults.m",resultsA]
resultsB=getRoute/@{"hespress.com","friend.com.kp","ma.gov.kp","airkoryo.com.kp","nta.gov.kp","ryongnamsan.edu.kp","cooks.org.kp","sdprk.org.kp","gnu.rep.kp","korfilm.com.kp","yandex.ru","ok.ru","avito.ru","gismeto.ru","wildberries.ru","drom.ru","haraj.com.sa","starzplay.com","cimaclub.com","moi.gov.sa","souq.com","vnexpress.net","zing.vn","24h.com.vn","kenh14.vn","shopee.vn","baomoi.com","ehawaii.gov","webmasterserviceshawaii.com","manoa.hawaii.edu","alaska.gov","adn.com","uaf.edu","alaskawildlife.org","detik.com","shopee.co.id","bukalapak.com","kompas.com","sermitsiaq.ag","banken.gl","tusass.gl","eltiempo.com","computrabajo.com.co","caracoltv.com","canalrcn.com","elcomercio.pe","www.sunat.gob.pe","mercadolibre.com.pe","larepublica.pe","www.viabcp.com","ouedkniss.com"};Save["C:\\Users\\alice\\OneDrive\\Desktop\\Schoolwork\\Wolfram Camp\\Project\\.GlobalResults.m",resultsB]
resultsC=getRoute/@{"ency-education.com","startimes.com","elkhabar.com","trademe.co.nz","stuff.co.nz","nzherald.co.nz","ird.govt.nz","bet9ja.com","jumia.com.ng","nairaland.com","betradar.com","ghanaweb.com","lightdl.xyz","ug.edu.gh","nss.gov.gh","yandex.uz","mover.uz","olx.uz","gov.uz","xcite.com","talabat.com","www.knetpay.com.kw","moi.gov.kw","daraz.pk","watchonlinemovies.com.pk","7starhd.work","punjab.gov.pk","ukr.net","sinoptik.ua","rozetka.com.ua","prom.ua","mit.edu","harvard.edu","princeton.edu","stonybrook.edu","columbia.edu","stanford.edu","umich.edu","cmu.edu","ut.edu","utexas.edu","risd.edu","ua.edu","wisc.edu","washington.edu","georgetown.edu","uchicago.edu","cornell.edu","berkeley.edu","vanderbilt.edu","phoenix.edu","illinois.edu","mines.edu","umass.edu","reddit.com","wolfram.com","baidu.com","bbc.co.uk","ikea.com","mail.ru","yahoo.co.jp","minecraft.net","github.io"};Save["C:\\Users\\alice\\OneDrive\\Desktop\\Schoolwork\\Wolfram Camp\\Project\\Results.m",resultsC]
resultsD=getRoute/@(RandomSample[("151.101."<>ToString[#]<>".13"&)/@Range[255],20]);Save["C:\\Users\\alice\\OneDrive\\Desktop\\Schoolwork\\Wolfram Camp\\Project\\.GlobalResults.m",resultsD]
I saved these results to a file because the getRoute function can take time to run.
In[]:=
Get["C:/Users/alice/OneDrive/Desktop/Schoolwork/Wolfram Camp/Project/Results/.GlobalResults.m"];
In[]:=
totalResults=cleanResults/@(ToExpression/@Drop[Names["results*"],1]);
In[]:=
locationAndMeans=GetLocationAndMeanTime/@totalResults;
Visualizing our Data
Visualizing our Data
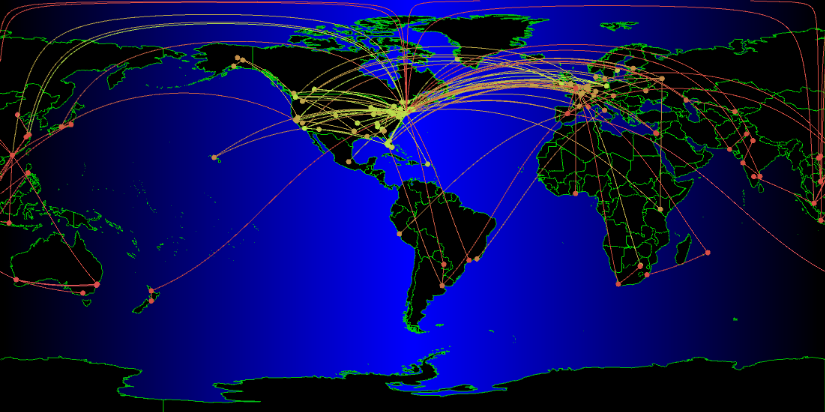
Here, I generated a map with the locations plotted and connected to each other. The greener colors represent faster ping times, while the red ping times are slower.
In[]:=
GeoGraphics[{GenerateGeoPaths[locationAndMeans,"NeonColors"]},GeoCenterHere,GeoZoomLevel3]
Out[]=
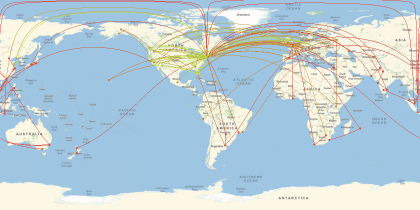
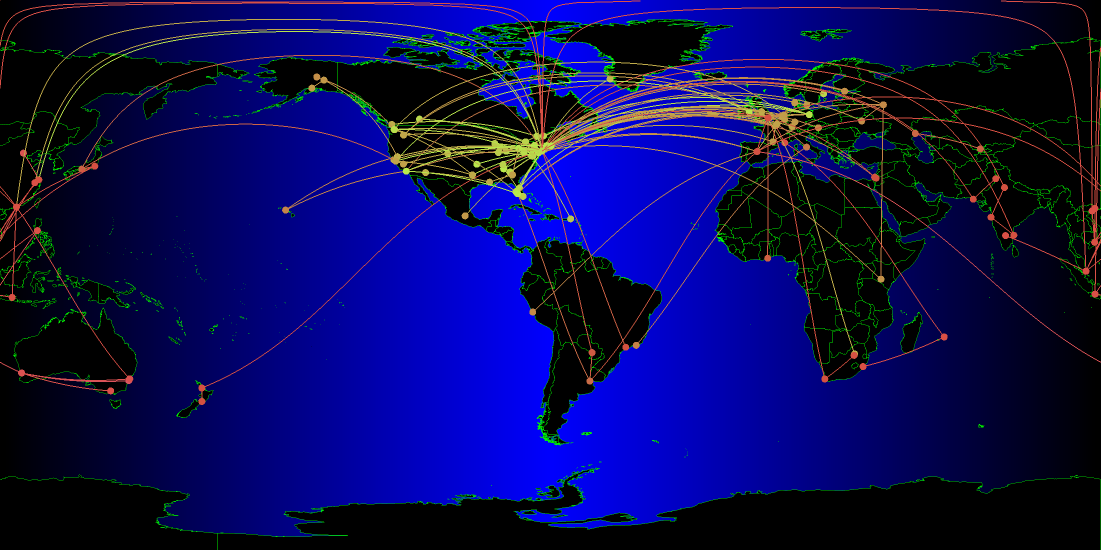
and adding on some aesthetic changes...
In[]:=
GeoGraphicsGeoStyling["OutlineMap",Directive[Black,EdgeForm[Directive[{Thin,Opacity[0.75],Green}]]]],Polygon
,
,
,
,{GenerateGeoPaths[locationAndMeans,"NeonColors"]},GeoCenterHere,GeoZoomLevel3,GeoBackgroundLinearGradientImage[{Black,Blue,Black}]
 | all countries, dependencies, and territories | COUNTRIES |
Alaska, United States | ADMINISTRATIVE DIVISION |
Antarctica | GEOGRAPHIC REGION |
Hawaii, United States | ADMINISTRATIVE DIVISION |
Out[]=
Determining optimal routes
Determining optimal routes
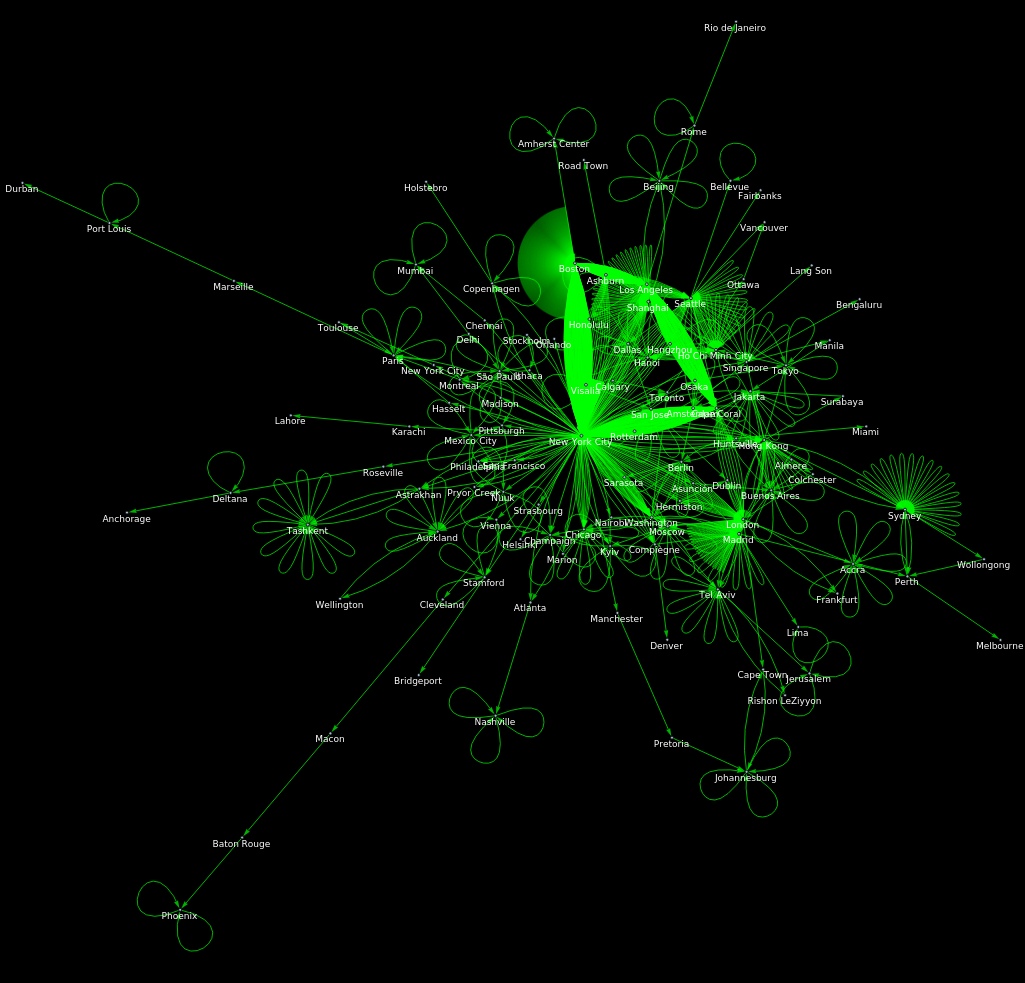
I also generated a directed graph where locations of routers are represented by nodes. Graphs allow us to run shortest path algorithms and also allow for an interesting alternative visualization of the networks. Notice that there are many self-loops on many of the vertices. This could possibly be the result of IP addresses being located too close together. Also, I decreased the opacity on the self-loop routes from my current location to my current location in order to emphasize the other routes.
In[]:=
generateGraphs[locationAndMeans]
Out[]=
Some examples....
Some examples....
Here are some examples of me using my shortestPath function. Feel free to put whatever website you want as an input.
In[]:=
shortestPath["wolfram.com"]
Out[]=
,,
Boston
New York City
Champaign
In[]:=
shortestPath["instagram.com"]
Out[]=
,
Boston
New York City
In[]:=
shortestPath["baidu.com"]
Out[]=
,,,
Boston
New York City
Shanghai
Beijing
In[]:=
shortestPath["www.sjc.ox.ac.uk"]
Out[]=
,,
Boston
New York City
London
In[]:=
shortestPath["stanford.edu"]
Out[]=
,,
Boston
New York City
San Jose
In[]:=
shortestPath["shellshock.io"]
Out[]=
,
Boston
New York City
In[]:=
shortestPath["india.gov.in"]
Out[]=
,,
Boston
New York City
Delhi
In[]:=
shortestPath["stephenwolfram.com"]
Out[]=
,,
Boston
New York City
Champaign
Limitations
Limitations
There are many limitations with our results that prevent them from being fully accurate.
For example, the coordinates associated with an IP Address does not always give us an accurate approximation of the host location. Also, on some hops, the nodes did not provide us with an IP Address, and consequently, they could not be used in our dataset. Additionally, in order to find the most efficient route, our algorithm relies on the current data I have already gathered, which raises the need for potentially crowdsourcing more data from the public.
For example, the coordinates associated with an IP Address does not always give us an accurate approximation of the host location. Also, on some hops, the nodes did not provide us with an IP Address, and consequently, they could not be used in our dataset. Additionally, in order to find the most efficient route, our algorithm relies on the current data I have already gathered, which raises the need for potentially crowdsourcing more data from the public.
Future Work
Future Work
Potential future results include the implementation of this project in different geolocations in order to gather information and see how packets travel from different parts of the world. This could be accomplished through crowdsourcing data from people of different parts of the world. I could also compare the optimal theoretical routes to the ones that exist in real life and examine the feasibility of implementing theoretical routes in order to design more efficient network systems.
Cite this as: Alice Liu, "Visualizing Routing and Determining Optimal Paths" from the Notebook Archive (2019), https://notebookarchive.org/2019-07-5k04kel
Download
