Data Collapse from Analog Errors in Quantum Annealing: Doom and Hope
Author
Adam Pearson, Daniel Lidar
Title
Data Collapse from Analog Errors in Quantum Annealing: Doom and Hope
Description
This notebook contains the entirety of the bootstrapped TTS data and the analysis thereof to arrive at the main conclusion of the paper (https://arxiv.org/abs/1907.12678): on the random Ising instances tested, classical repetition (C) scales worse than dynamic programming (DP), while quantum annealing correction (QAC) scales better.
Category
Academic Articles & Supplements
Keywords
URL
http://www.notebookarchive.org/2019-10-ana4eit/
DOI
https://notebookarchive.org/2019-10-ana4eit
Date Added
2019-10-23
Date Last Modified
2019-10-23
File Size
4.43 megabytes
Supplements
Rights
Redistribution rights reserved

Analog Errors in Quantum Annealing: Doom and Hope
Analog Errors in Quantum Annealing: Doom and Hope
Data Collapse Notebook
Authors: Adam Pearson and Daniel Lidar, University of Southern California
Authors: Adam Pearson and Daniel Lidar, University of Southern California
This notebook contains the entirety of the bootstrapped TTS data and the analysis thereof to arrive at the main conclusion of the paper: on the random Ising instances tested, classical repetition (C) scales worse than dynamic programming (DP), while quantum annealing correction (QAC) scales better.
The analysis consists of fitting the data (after taking Log base 10) to five test functions in four ways each:
1) Unconstrained parameters vs. L
2) Squared parameters vs L
3) Unconstrained parameters vs. an effective L
4) Squared parameters vs. an effective L.
Details regarding these methods and the test functions used can be found in section 1. Each of these fits was done using Mathematica’s NonlinearModelFit[...] function with all optimization algorithms provided in section 2. Tables containing the results are given in sections 3-6 with an overall summary in section 7. A fit to the error bar data based on these results is given in section 8. This notebook has been provided to ensure clarity in the procedure used, which in turn should be easily modifiable.
The contents are as follows:
1) Setup
2) Fitting
3) TTS vs. L Fit with Unconstrained Parameters
4) TTS vs. L Fit with Squared Parameters
5) TTS vs. Effective L Fit with Unconstrained Parameters
6) TTS vs. Effective L Fit with Squared Parameters
7) Summary
8) Error Bar Fitting
1) Setup
1) Setup
This section contains the initialization of all parameters and data used. If one wishes to use different or fewer optimization algorithms, simply change the list ‘method’ defined directly below. Furthermore, the specific test functions used and an initial guess as to their parameter values can be updated below. The rest is data that should likely be kept as is.
SetOptions[NonlinearModelFit,MaxIterations100000,AccuracyGoalAutomatic,PrecisionGoalAutomatic];method={SimulatedAnnealing,RandomSearch,NelderMead,DifferentialEvolution};
Unconstrained Test Functions
Unconstrained Test Functions
The following test functions have no generically imposed constraints on their parameters, thus allowing for unphysical fits as described for each. The functions are:1) This is best fit found by the methods below. If , then there is an increasing performance with larger problem size.If , then there is an increasing performance with higher noise.2) This is fit 1 with an extra parameter. If , then TTS(L)<1, which is a fraction of an anneal. If , then there is an increasing performance with larger problem size. If , then there is an increasing performance with higher noise.3) This is the algorithmically motivated fit since it assumes asymptotic scaling with .If , then TTS(L)<1, which is a fraction of an anneal. If , then there is an increasing performance with larger problem size. 4) This is fit 3 with an extra parameter corresponding to the scaling of the noise.If , then TTS(L)<1, which is a fraction of an anneal. If , then there is an increasing performance with larger problem size. If , then there is an increasing performance with higher noise.5) This is fit 3 with an extra parameter corresponding to the scaling of the problem size.If , then TTS(L)<1, which is a fraction of an anneal. If , then there is an increasing performance with larger problem size.
a
c
+
2
η
2
b
d
L
a,d<0
c<0
a+c
b
+
2
η
2
d
e
L
a<0
L0
c,e<0
b<0
a+bL+c++Log10()
2
η
2
d
2
L
2
L
2
L
a<0
L0
b,c<0
a+bL+c+Log10()
e
+
2
η
2
d
2
L
2
L
a<0
L0
b,c<0
e<0
a+bL+c++Log10()
2
η
2
d
e
L
2
L
a<0
L0
b,c,e<0
testfunc[1,L_,eta_]=a(eta^2+b^2)^cL^d;testfunc[2,L_,eta_]=a+c(eta^2+d^2)^bL^e;testfunc[3,L_,eta_]=a+bL+c(eta^2+d^2)^(1/2)L^2+2Log10[L];testfunc[4,L_,eta_]=a+bL+c(eta^2+d^2)^eL^2+2Log10[L];testfunc[5,L_,eta_]=a+bL+c(eta^2+d^2)^(1/2)L^e+2Log10[L];
Unconstrained Test Functions
Unconstrained Test Functions
The following test functions are the same as the above, but with all parameters squared in order to enforce positivity and thus avoid unphysical fits.1) 2) +3) +L+++Log10()4) +L++Log10()5) +L+++Log10()
2
a
2
c
+
2
η
2
b
2
d
L
2
a
2
c
2
b
+
2
η
2
d
2
e
L
2
a
2
b
2
c
2
η
2
d
2
L
2
L
2
a
2
b
2
c
2
e
+
2
η
2
d
2
L
2
L
2
a
2
b
2
c
2
η
2
d
2
e
L
2
L
testfsq[1,L_,eta_]=a^2(eta^2+b^2)^(c^2)L^(d^2);testfsq[2,L_,eta_]=a^2+c^2(eta^2+d^2)^(b^2)L^(e^2);testfsq[3,L_,eta_]=a^2+b^2L+c^2(eta^2+d^2)^(1/2)L^2+2Log10[L];testfsq[4,L_,eta_]=a^2+b^2L+c^2(eta^2+d^2)^(e^2)L^2+2Log10[L];testfsq[5,L_,eta_]=a^2+b^2L+c^2(eta^2+d^2)^(1/2)L^(e^2)+2Log10[L];
Initial Parameter Guess
Initial Parameter Guess
These are the definitions of the parameters along with their initial guesses for each fit (1 - 5). The guesses help the fitting to converge more quickly, but can
be removed by replacing each line with the corresponding commented out list of parameters.
be removed by replacing each line with the corresponding commented out list of parameters.
params[1]={{a,1},{b,0.1},{c,0.5},{d,2}};(*{a,b,c,d};*)params[2]={{a,1},{b,0.5},{c,1},{d,0.1},{e,2}};(*{a,b,c,d,e};*)params[3]={{a,1},{b,1},{c,1},{d,0.5}};(*{a,b,c,d};*)params[4]={{a,1},{b,1},{c,1},{d,0.5},{e,0.5}};(*{a,b,c,d,e};*)params[5]={{a,1},{b,1},{c,1},{d,0.5},{e,2}};(*{a,b,c,d,e};*)
Data
Data
(*Artificiallyaddednoisevalues*)η[1]=0;η[2]=0.03;η[3]=0.05;η[4]=0.07;η[5]=0.1;η[6]=0.15;(*Actualnumberofactive=couplersforL=2to16*)JS={8,16,28,48,67,93,123,157,197,235,279,457,536,621,707};Leffs=1/3(1+Sqrt[1+3*JS]);(*GettingeffectiveLsfromJ=L(3L-2),wherethepositivesolutionsofLareoftheformabove*)
Raw time-to-solution data from D-Wave runs. Entries are in the format {L, TTS in units of 5μs, lower TTS error, upper TTS error}.
2) Fitting
2) Fitting
We use NonlinearModelFit[...] with each optimization method and each test function specified in the setup above. We caution that the DifferentialEvolution method takes substantially longer than the other three, and does not produces different results. It can therefore be omitted if desired, by replacing Length[method] in the For loop below by Length[method]-1.
(*Definingtheresultingfitsasfunctions*)For[i=1,i≤Length[method],i++,For[j=1,j≤5,j++,gCuncL[i,j,L_,eta_]=Normal[fitCuncL[i,j]];gQACuncL[i,j,L_,eta_]=Normal[fitQACuncL[i,j]];gCsqL[i,j,L_,eta_]=Normal[fitCsqL[i,j]];gQACsqL[i,j,L_,eta_]=Normal[fitQACsqL[i,j]];gCuncJ[i,j,J_,eta_]=Normal[fitCuncJ[i,j]];gQACuncJ[i,j,J_,eta_]=Normal[fitQACuncJ[i,j]];gCsqJ[i,j,J_,eta_]=Normal[fitCsqJ[i,j]];gQACsqJ[i,j,J_,eta_]=Normal[fitQACsqJ[i,j]];]]
3) TTS vs. L Fit with Unconstrained Parameters
3) TTS vs. L Fit with Unconstrained Parameters
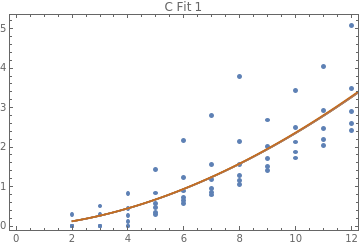
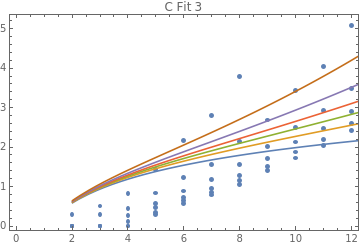
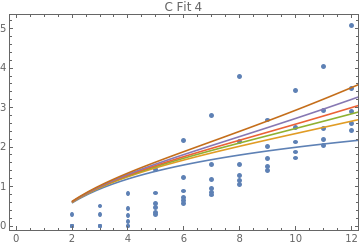
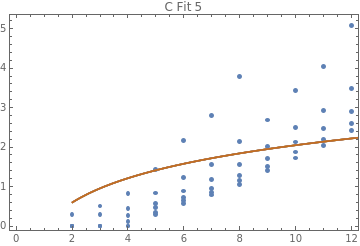
C
C
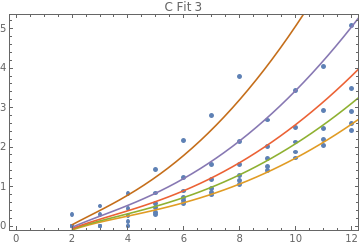
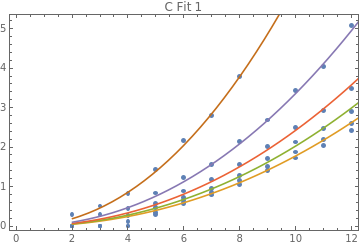
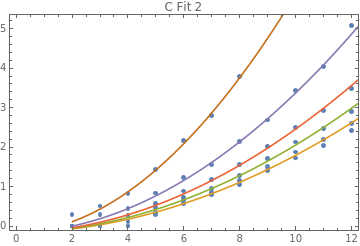
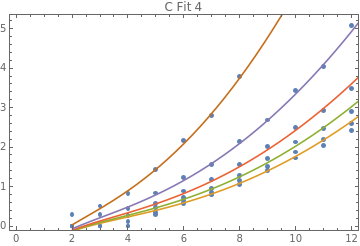
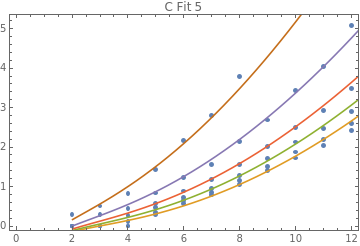
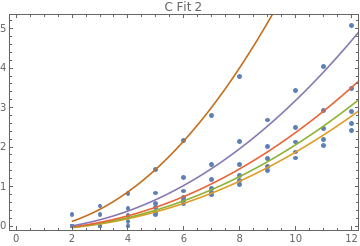
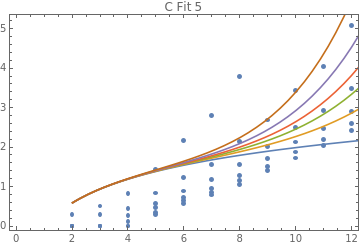
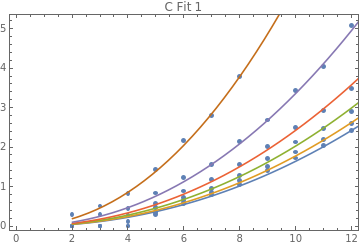
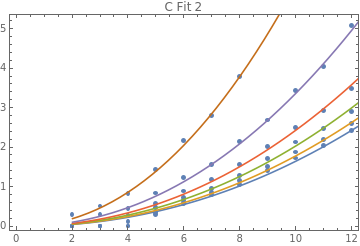
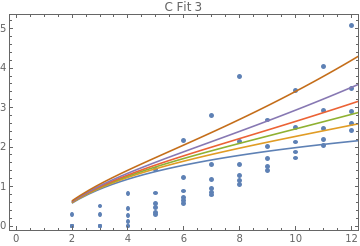
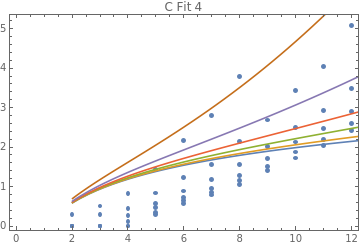
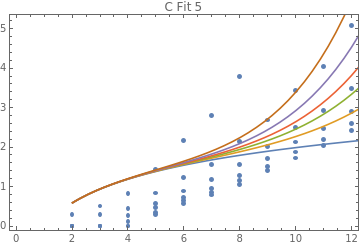
For[i=1,i≤Length[method],i++,Print[method[[i]]];Print[resultsCuncL[i][[1]][[1]]];Print[resultsCuncL[i][[1]][[2;;3]]];Print[resultsCuncL[i][[1]][[4;;5]]];Print[resultsCuncL[i][[1]][[6;;7]]];Print[resultsCuncL[i][[1]][[8;;9]]];Print[resultsCuncL[i][[1]][[10;;11]]];Print[Table[Show[ListPlot[LdataC],Plot[{gCuncL[i,j,L,0.0][[1]],gCuncL[i,j,L,0.03][[2]],gCuncL[i,j,L,0.05][[2]],gCuncL[i,j,L,0.07][[2]],gCuncL[i,j,L,0.10][[2]],gCuncL[i,j,L,0.15][[2]]},{L,2,16}],FrameTrue,PlotLabel"C Fit "<>ToString[j]],{j,1,5}]];]
SimulatedAnnealing
{ParameterTable,ParameterConfidenceIntervalTable,RSquared,EstimatedVariance}
a,
,
,0.997726,0.0078036
c
(+)
2
b
2
eta
d
L
Estimate | Standard Error | t-Statistic | P-Value | |
a | 8.0071 | 4.2867 | 1.8679 | 0.0668314 |
b | 0.133837 | 0.0126548 | 10.576 | 3.73945× -15 10 |
c | 1.60653 | 0.213495 | 7.52492 | 3.84356× -10 10 |
d | 2.12257 | 0.0328644 | 64.5855 | 9.97501× -56 10 |
Estimate | Standard Error | Confidence Interval | |
a | 8.0071 | 4.2867 | {-0.573655,16.5879} |
b | 0.133837 | 0.0126548 | {0.108506,0.159168} |
c | 1.60653 | 0.213495 | {1.17918,2.03389} |
d | 2.12257 | 0.0328644 | {2.05678,2.18835} |
a+c,
,
,0.998522,0.00516041
b
(+)
2
d
2
eta
e
L
Estimate | Standard Error | t-Statistic | P-Value | |
a | -0.146636 | 0.0278134 | -5.27212 | 2.15844× -6 10 |
b | 1.33751 | 0.14075 | 9.50271 | 2.35692× -13 10 |
c | 5.69552 | 2.00104 | 2.84629 | 0.00613733 |
d | -0.124134 | 0.00928022 | -13.3762 | 3.15046× -19 10 |
e | 1.92702 | 0.0421541 | 45.7138 | 1.30136× -46 10 |
Estimate | Standard Error | Confidence Interval | |
a | -0.146636 | 0.0278134 | {-0.202331,-0.0909402} |
b | 1.33751 | 0.14075 | {1.05566,1.61935} |
c | 5.69552 | 2.00104 | {1.68852,9.70253} |
d | -0.124134 | 0.00928022 | {-0.142717,-0.105551} |
e | 1.92702 | 0.0421541 | {1.84261,2.01143} |
a+bL+c++,
,
,0.992498,0.0257446
2
d
2
eta
2
L
2Log[L]
Log[10]
Estimate | Standard Error | t-Statistic | P-Value | |
a | -0.197233 | 0.101014 | -1.95252 | 0.0557085 |
b | -0.303691 | 0.0331632 | -9.15746 | 7.29778× -13 10 |
c | 0.380156 | 0.0143468 | 26.4977 | 4.25335× -34 10 |
d | 0.0722806 | 0.00450201 | 16.0552 | 5.22976× -23 10 |
Estimate | Standard Error | Confidence Interval | |
a | -0.197233 | 0.101014 | {-0.399435,0.0049697} |
b | -0.303691 | 0.0331632 | {-0.370074,-0.237307} |
c | 0.380156 | 0.0143468 | {0.351438,0.408875} |
d | 0.0722806 | 0.00450201 | {0.0632689,0.0812924} |
a+bL+c+,
,
,0.99746,0.00886808
e
(+)
2
d
2
eta
2
L
2Log[L]
Log[10]
Estimate | Standard Error | t-Statistic | P-Value | |
a | -0.242591 | 0.0596354 | -4.06791 | 0.000147467 |
b | -0.299675 | 0.0195966 | -15.2922 | 7.8617× -22 10 |
c | 10.0011 | 7.41521 | 1.34873 | 0.182759 |
d | -0.176363 | 0.0234549 | -7.51925 | 4.33652× -10 10 |
e | 1.68566 | 0.335816 | 5.01959 | 5.40334× -6 10 |
Estimate | Standard Error | Confidence Interval | |
a | -0.242591 | 0.0596354 | {-0.362009,-0.123173} |
b | -0.299675 | 0.0195966 | {-0.338916,-0.260433} |
c | 10.0011 | 7.41521 | {-4.84761,24.8498} |
d | -0.176363 | 0.0234549 | {-0.223331,-0.129396} |
e | 1.68566 | 0.335816 | {1.0132,2.35812} |
a+bL+c++,
,
,0.99657,0.011975
2
d
2
eta
e
L
2Log[L]
Log[10]
Estimate | Standard Error | t-Statistic | P-Value | |
a | 0.102851 | 0.0968661 | 1.06179 | 0.29281 |
b | -0.730694 | 0.106073 | -6.88862 | 4.87705× -9 10 |
c | 1.66538 | 0.304898 | 5.46209 | 1.07325× -6 10 |
d | -0.130092 | 0.0119755 | -10.8632 | 1.65721× -15 10 |
e | 1.49779 | 0.0563764 | 26.5676 | 8.54057× -34 10 |
Estimate | Standard Error | Confidence Interval | |
a | 0.102851 | 0.0968661 | {-0.0911198,0.296822} |
b | -0.730694 | 0.106073 | {-0.9431,-0.518287} |
c | 1.66538 | 0.304898 | {1.05483,2.27593} |
d | -0.130092 | 0.0119755 | {-0.154073,-0.106112} |
e | 1.49779 | 0.0563764 | {1.38489,1.61068} |
 ,
, ,
, ,
, ,
,
RandomSearch
{ParameterTable,ParameterConfidenceIntervalTable,RSquared,EstimatedVariance}
a,
,
,0.997726,0.00780359
c
(+)
2
b
2
eta
d
L
Estimate | Standard Error | t-Statistic | P-Value | |
a | 8.01409 | 4.29181 | 1.8673 | 0.0669162 |
b | 0.133857 | 0.0126581 | 10.5748 | 3.755× -15 10 |
c | 1.60688 | 0.213578 | 7.5236 | 3.86322× -10 10 |
d | 2.12259 | 0.0328648 | 64.5854 | 9.97557× -56 10 |
Estimate | Standard Error | Confidence Interval | |
a | 8.01409 | 4.29181 | {-0.576905,16.6051} |
b | 0.133857 | 0.0126581 | {0.108519,0.159195} |
c | 1.60688 | 0.213578 | {1.17935,2.0344} |
d | 2.12259 | 0.0328648 | {2.0568,2.18837} |
a+c,
,
,0.998522,0.00516041
b
(+)
2
d
2
eta
e
L
Estimate | Standard Error | t-Statistic | P-Value | |
a | -0.146635 | 0.0278134 | -5.2721 | 2.15865× -6 10 |
b | 1.33752 | 0.140751 | 9.50268 | 2.35719× -13 10 |
c | 5.69563 | 2.00109 | 2.84626 | 0.00613771 |
d | -0.124134 | 0.00928027 | -13.3761 | 3.15068× -19 10 |
e | 1.92702 | 0.0421541 | 45.7138 | 1.30132× -46 10 |
Estimate | Standard Error | Confidence Interval | |
a | -0.146635 | 0.0278134 | {-0.20233,-0.0909394} |
b | 1.33752 | 0.140751 | {1.05567,1.61936} |
c | 5.69563 | 2.00109 | {1.68852,9.70275} |
d | -0.124134 | 0.00928027 | {-0.142718,-0.105551} |
e | 1.92702 | 0.0421541 | {1.84261,2.01144} |
a+bL+c++,
,
,0.992498,0.0257446
2
d
2
eta
2
L
2Log[L]
Log[10]
Estimate | Standard Error | t-Statistic | P-Value | |
a | -0.197233 | 0.101014 | -1.95252 | 0.0557085 |
b | -0.303691 | 0.0331632 | -9.15746 | 7.29779× -13 10 |
c | 0.380156 | 0.0143468 | 26.4976 | 4.25336× -34 10 |
d | 0.0722806 | 0.00450201 | 16.0552 | 5.22974× -23 10 |
Estimate | Standard Error | Confidence Interval | |
a | -0.197233 | 0.101014 | {-0.399435,0.00496965} |
b | -0.303691 | 0.0331632 | {-0.370074,-0.237307} |
c | 0.380156 | 0.0143468 | {0.351438,0.408875} |
d | 0.0722806 | 0.00450201 | {0.0632689,0.0812924} |
a+bL+c+,
,
,0.99746,0.00886808
e
(+)
2
d
2
eta
2
L
2Log[L]
Log[10]
Estimate | Standard Error | t-Statistic | P-Value | |
a | -0.242603 | 0.0596354 | -4.0681 | 0.000147372 |
b | -0.299671 | 0.0195966 | -15.292 | 7.86591× -22 10 |
c | 10.0012 | 7.41527 | 1.34873 | 0.182759 |
d | -0.176363 | 0.0234548 | -7.51927 | 4.33616× -10 10 |
e | 1.68566 | 0.335814 | 5.01962 | 5.40286× -6 10 |
Estimate | Standard Error | Confidence Interval | |
a | -0.242603 | 0.0596354 | {-0.36202,-0.123185} |
b | -0.299671 | 0.0195966 | {-0.338913,-0.26043} |
c | 10.0012 | 7.41527 | {-4.84764,24.85} |
d | -0.176363 | 0.0234548 | {-0.22333,-0.129395} |
e | 1.68566 | 0.335814 | {1.0132,2.35812} |
a+bL+c++,
,
,0.99657,0.011975
2
d
2
eta
e
L
2Log[L]
Log[10]
Estimate | Standard Error | t-Statistic | P-Value | |
a | 0.102785 | 0.096862 | 1.06115 | 0.293099 |
b | -0.730589 | 0.106051 | -6.88904 | 4.86927× -9 10 |
c | 1.66508 | 0.304837 | 5.46221 | 1.07274× -6 10 |
d | 0.13008 | 0.0119738 | 10.8637 | 1.65402× -15 10 |
e | 1.49784 | 0.056377 | 26.5683 | 8.52874× -34 10 |
Estimate | Standard Error | Confidence Interval | |
a | 0.102785 | 0.096862 | {-0.091178,0.296748} |
b | -0.730589 | 0.106051 | {-0.942952,-0.518225} |
c | 1.66508 | 0.304837 | {1.05466,2.27551} |
d | 0.13008 | 0.0119738 | {0.106103,0.154057} |
e | 1.49784 | 0.056377 | {1.38495,1.61073} |
 ,
, ,
, ,
, ,
,
NelderMead
{ParameterTable,ParameterConfidenceIntervalTable,RSquared,EstimatedVariance}
a,
,
,0.997726,0.00780359
c
(+)
2
b
2
eta
d
L
Estimate | Standard Error | t-Statistic | P-Value | |
a | 8.01339 | 4.2913 | 1.86736 | 0.0669078 |
b | 0.133855 | 0.0126578 | 10.5749 | 3.7535× -15 10 |
c | 1.60684 | 0.21357 | 7.52373 | 3.8613× -10 10 |
d | 2.12258 | 0.0328647 | 64.5855 | 9.97553× -56 10 |
Estimate | Standard Error | Confidence Interval | |
a | 8.01339 | 4.2913 | {-0.576582,16.6034} |
b | 0.133855 | 0.0126578 | {0.108518,0.159193} |
c | 1.60684 | 0.21357 | {1.17934,2.03435} |
d | 2.12258 | 0.0328647 | {2.0568,2.18837} |
a+c,
,
,0.99569,0.0150493
b
(+)
2
d
2
eta
e
L
Estimate | Standard Error | t-Statistic | P-Value | |
a | -0.0967007 | 0.0449455 | -2.15151 | 0.0356866 |
b | 53.5167 | 334.12 | 0.160172 | 0.873312 |
c | 0.187205 | 60.3332 | 0.00310285 | 0.997535 |
d | -0.977257 | 3.08243 | -0.317041 | 0.752371 |
e | 2.07385 | 0.0768725 | 26.9778 | 3.79866× -34 10 |
Estimate | Standard Error | Confidence Interval | |
a | -0.0967007 | 0.0449455 | {-0.186703,-0.0066989} |
b | 53.5167 | 334.12 | {-615.546,722.58} |
c | 0.187205 | 60.3332 | {-120.628,121.002} |
d | -0.977257 | 3.08243 | {-7.14972,5.1952} |
e | 2.07385 | 0.0768725 | {1.91992,2.22779} |
a+bL+c++,
,
,0.992498,0.0257446
2
d
2
eta
2
L
2Log[L]
Log[10]
Estimate | Standard Error | t-Statistic | P-Value | |
a | -0.197231 | 0.101014 | -1.9525 | 0.0557103 |
b | -0.303691 | 0.0331632 | -9.15747 | 7.29736× -13 10 |
c | 0.380157 | 0.0143468 | 26.4977 | 4.25322× -34 10 |
d | -0.0722807 | 0.004502 | -16.0552 | 5.22935× -23 10 |
Estimate | Standard Error | Confidence Interval | |
a | -0.197231 | 0.101014 | {-0.399434,0.00497121} |
b | -0.303691 | 0.0331632 | {-0.370075,-0.237308} |
c | 0.380157 | 0.0143468 | {0.351438,0.408875} |
d | -0.0722807 | 0.004502 | {-0.0812925,-0.063269} |
a+bL+c+,
,
,0.99746,0.00886808
e
(+)
2
d
2
eta
2
L
2Log[L]
Log[10]
Estimate | Standard Error | t-Statistic | P-Value | |
a | -0.242608 | 0.0596354 | -4.06819 | 0.00014733 |
b | -0.299668 | 0.0195966 | -15.2919 | 7.86952× -22 10 |
c | 10.0046 | 7.41879 | 1.34855 | 0.182814 |
d | -0.176372 | 0.0234574 | -7.51883 | 4.34346× -10 10 |
e | 1.68581 | 0.335872 | 5.01922 | 5.4106× -6 10 |
Estimate | Standard Error | Confidence Interval | |
a | -0.242608 | 0.0596354 | {-0.362026,-0.12319} |
b | -0.299668 | 0.0195966 | {-0.33891,-0.260427} |
c | 10.0046 | 7.41879 | {-4.85124,24.8605} |
d | -0.176372 | 0.0234574 | {-0.223345,-0.1294} |
e | 1.68581 | 0.335872 | {1.01324,2.35839} |
a+bL+c++,
,
,0.957588,0.148093
2
d
2
eta
e
L
2Log[L]
Log[10]
Estimate | Standard Error | t-Statistic | P-Value | |
a | -130.518 | 1820.37 | -0.0716986 | 0.943093 |
b | 0.526942 | 0.107025 | 4.92354 | 7.63156× -6 10 |
c | 137.673 | 937.001 | 0.146929 | 0.883706 |
d | 0.942314 | 6.80912 | 0.13839 | 0.89042 |
e | -0.014917 | 0.209954 | -0.071049 | 0.943607 |
Estimate | Standard Error | Confidence Interval | |
a | -130.518 | 1820.37 | {-3775.74,3514.71} |
b | 0.526942 | 0.107025 | {0.312628,0.741256} |
c | 137.673 | 937.001 | {-1738.64,2013.98} |
d | 0.942314 | 6.80912 | {-12.6927,14.5773} |
e | -0.014917 | 0.209954 | {-0.435343,0.405509} |
 ,
, ,
, ,
, ,
,
DifferentialEvolution
{ParameterTable,ParameterConfidenceIntervalTable,RSquared,EstimatedVariance}
a,
,
,0.997726,0.00780359
c
(+)
2
b
2
eta
d
L
Estimate | Standard Error | t-Statistic | P-Value | |
a | 8.01443 | 4.29209 | 1.86725 | 0.0669224 |
b | 0.133859 | 0.0126584 | 10.5747 | 3.75643× -15 10 |
c | 1.6069 | 0.213584 | 7.52349 | 3.86489× -10 10 |
d | 2.12259 | 0.0328649 | 64.5855 | 9.97552× -56 10 |
Estimate | Standard Error | Confidence Interval | |
a | 8.01443 | 4.29209 | {-0.57713,16.606} |
b | 0.133859 | 0.0126584 | {0.10852,0.159197} |
c | 1.6069 | 0.213584 | {1.17936,2.03444} |
d | 2.12259 | 0.0328649 | {2.05681,2.18838} |
a+c,
,
,0.998522,0.00516041
b
(+)
2
d
2
eta
e
L
Estimate | Standard Error | t-Statistic | P-Value | |
a | -0.146633 | 0.0278133 | -5.27203 | 2.15915× -6 10 |
b | 1.33754 | 0.140756 | 9.50254 | 2.35843× -13 10 |
c | 5.69597 | 2.00127 | 2.84618 | 0.0061391 |
d | 0.124136 | 0.00928048 | 13.376 | 3.15195× -19 10 |
e | 1.92703 | 0.0421542 | 45.7138 | 1.3013× -46 10 |
Estimate | Standard Error | Confidence Interval | |
a | -0.146633 | 0.0278133 | {-0.202328,-0.0909374} |
b | 1.33754 | 0.140756 | {1.05568,1.6194} |
c | 5.69597 | 2.00127 | {1.6885,9.70344} |
d | 0.124136 | 0.00928048 | {0.105552,0.14272} |
e | 1.92703 | 0.0421542 | {1.84262,2.01144} |
a+bL+c++,
,
,0.992498,0.0257446
2
d
2
eta
2
L
2Log[L]
Log[10]
Estimate | Standard Error | t-Statistic | P-Value | |
a | -0.197232 | 0.101014 | -1.95251 | 0.0557096 |
b | -0.303691 | 0.0331632 | -9.15747 | 7.2975× -13 10 |
c | 0.380157 | 0.0143468 | 26.4977 | 4.25326× -34 10 |
d | -0.0722807 | 0.004502 | -16.0552 | 5.22946× -23 10 |
Estimate | Standard Error | Confidence Interval | |
a | -0.197232 | 0.101014 | {-0.399434,0.00497057} |
b | -0.303691 | 0.0331632 | {-0.370075,-0.237308} |
c | 0.380157 | 0.0143468 | {0.351438,0.408875} |
d | -0.0722807 | 0.004502 | {-0.0812924,-0.063269} |
a+bL+c+,
,
,0.99746,0.00886808
e
(+)
2
d
2
eta
2
L
2Log[L]
Log[10]
Estimate | Standard Error | t-Statistic | P-Value | |
a | -0.242608 | 0.0596354 | -4.06819 | 0.000147329 |
b | -0.299669 | 0.0195966 | -15.2919 | 7.86854× -22 10 |
c | 10.003 | 7.41704 | 1.34865 | 0.182785 |
d | 0.176367 | 0.023456 | 7.51908 | 4.33941× -10 10 |
e | 1.68574 | 0.335842 | 5.01944 | 5.40632× -6 10 |
Estimate | Standard Error | Confidence Interval | |
a | -0.242608 | 0.0596354 | {-0.362026,-0.12319} |
b | -0.299669 | 0.0195966 | {-0.338911,-0.260428} |
c | 10.003 | 7.41704 | {-4.84941,24.8553} |
d | 0.176367 | 0.023456 | {0.129397,0.223337} |
e | 1.68574 | 0.335842 | {1.01323,2.35825} |
a+bL+c++,
,
,0.99657,0.011975
2
d
2
eta
e
L
2Log[L]
Log[10]
Estimate | Standard Error | t-Statistic | P-Value | |
a | 0.102788 | 0.0968621 | 1.06118 | 0.293082 |
b | -0.73059 | 0.106051 | -6.88904 | 4.8693× -9 10 |
c | 1.66508 | 0.304837 | 5.4622 | 1.07278× -6 10 |
d | -0.13008 | 0.0119738 | -10.8637 | 1.65403× -15 10 |
e | 1.49784 | 0.0563771 | 26.5683 | 8.52943× -34 10 |
Estimate | Standard Error | Confidence Interval | |
a | 0.102788 | 0.0968621 | {-0.0911746,0.296752} |
b | -0.73059 | 0.106051 | {-0.942954,-0.518227} |
c | 1.66508 | 0.304837 | {1.05466,2.27551} |
d | -0.13008 | 0.0119738 | {-0.154057,-0.106103} |
e | 1.49784 | 0.0563771 | {1.38495,1.61073} |
 ,
, ,
, ,
, ,
,
QAC
QAC
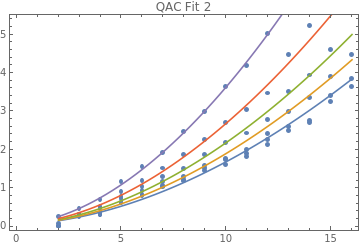
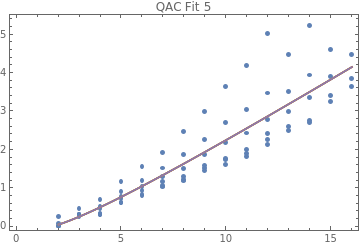
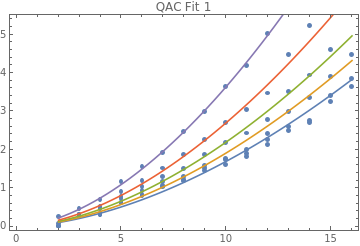
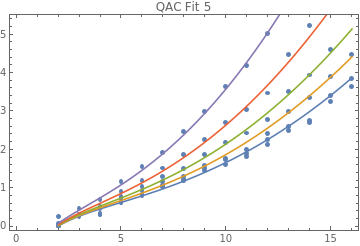
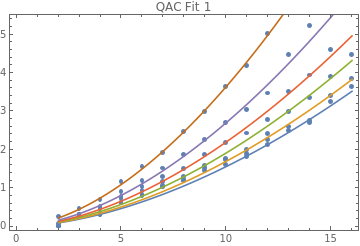
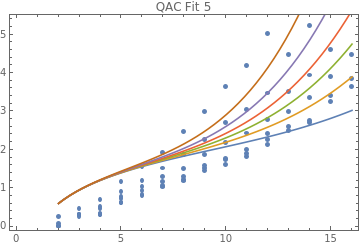
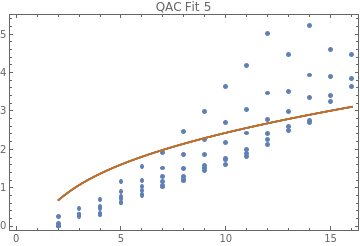
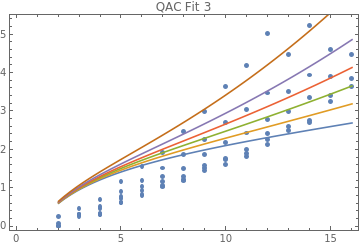
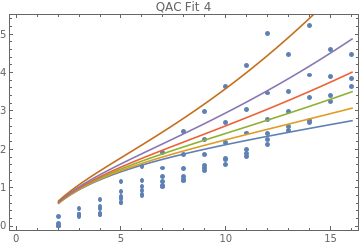
For[i=1,i≤Length[method],i++,Print[method[[i]]];Print[resultsQACuncL[i][[1]][[1]]];Print[resultsQACuncL[i][[1]][[2;;3]]];Print[resultsQACuncL[i][[1]][[4;;5]]];Print[resultsQACuncL[i][[1]][[6;;7]]];Print[resultsQACuncL[i][[1]][[8;;9]]];Print[resultsQACuncL[i][[1]][[10;;11]]];Print[Table[Show[ListPlot[LdataQAC],Plot[{gQACuncL[i,j,L,0.03][[2]],gQACuncL[i,j,L,0.05][[2]],gQACuncL[i,j,L,0.07][[2]],gQACuncL[i,j,L,0.10][[2]],gQACuncL[i,j,L,0.15][[2]]},{L,2,16}],FrameTrue,PlotLabel"QAC Fit "<>ToString[j]],{j,1,5}]];]
SimulatedAnnealing
{ParameterTable,ParameterConfidenceIntervalTable,RSquared,EstimatedVariance}
a,
,
,0.997471,0.0138501
c
(+)
2
b
2
eta
d
L
Estimate | Standard Error | t-Statistic | P-Value | |
a | 0.391744 | 0.0543284 | 7.21067 | 2.94758× -10 10 |
b | 0.0691215 | 0.00599542 | 11.529 | 1.32586× -18 10 |
c | 0.486342 | 0.0399582 | 12.1713 | 8.40295× -20 10 |
d | 1.72996 | 0.0253848 | 68.1492 | 6.00975× -72 10 |
Estimate | Standard Error | Confidence Interval | |
a | 0.391744 | 0.0543284 | {0.283606,0.499882} |
b | 0.0691215 | 0.00599542 | {0.0571879,0.081055} |
c | 0.486342 | 0.0399582 | {0.406807,0.565877} |
d | 1.72996 | 0.0253848 | {1.67943,1.78048} |
a+c,
,
,0.997537,0.0136638
b
(+)
2
d
2
eta
e
L
Estimate | Standard Error | t-Statistic | P-Value | |
a | 0.0624303 | 0.0408903 | 1.52678 | 0.130862 |
b | 0.503606 | 0.0426166 | 11.8171 | 4.64949× -19 10 |
c | 0.351987 | 0.0552762 | 6.36779 | 1.22259× -8 10 |
d | -0.0693736 | 0.00594126 | -11.6766 | 8.47533× -19 10 |
e | 1.79482 | 0.050008 | 35.8907 | 2.98042× -50 10 |
Estimate | Standard Error | Confidence Interval | |
a | 0.0624303 | 0.0408903 | {-0.018976,0.143837} |
b | 0.503606 | 0.0426166 | {0.418763,0.588449} |
c | 0.351987 | 0.0552762 | {0.241941,0.462034} |
d | -0.0693736 | 0.00594126 | {-0.0812017,-0.0575454} |
e | 1.79482 | 0.050008 | {1.69527,1.89438} |
a+bL+c++,
,
,0.998427,0.00861757
2
d
2
eta
2
L
2Log[L]
Log[10]
Estimate | Standard Error | t-Statistic | P-Value | |
a | -0.269325 | 0.0448594 | -6.00375 | 5.55501× -8 10 |
b | -0.19654 | 0.0118853 | -16.5364 | 2.2441× -27 10 |
c | 0.227705 | 0.00430755 | 52.8618 | 2.02974× -63 10 |
d | 0.0782753 | 0.00201424 | 38.8609 | 2.96871× -53 10 |
Estimate | Standard Error | Confidence Interval | |
a | -0.269325 | 0.0448594 | {-0.358615,-0.180034} |
b | -0.19654 | 0.0118853 | {-0.220198,-0.172883} |
c | 0.227705 | 0.00430755 | {0.219131,0.236279} |
d | 0.0782753 | 0.00201424 | {0.0742661,0.0822846} |
a+bL+c+,
,
,0.998427,0.00872793
e
(+)
2
d
2
eta
2
L
2Log[L]
Log[10]
Estimate | Standard Error | t-Statistic | P-Value | |
a | -0.269119 | 0.0454986 | -5.91488 | 8.34544× -8 10 |
b | -0.196594 | 0.0120473 | -16.3186 | 7.24556× -27 10 |
c | 0.226892 | 0.0263421 | 8.61327 | 6.07847× -13 10 |
d | -0.0781203 | 0.00540372 | -14.4568 | 9.03149× -24 10 |
e | 0.498907 | 0.034922 | 14.2863 | 1.77326× -23 10 |
Estimate | Standard Error | Confidence Interval | |
a | -0.269119 | 0.0454986 | {-0.359699,-0.178538} |
b | -0.196594 | 0.0120473 | {-0.220578,-0.17261} |
c | 0.226892 | 0.0263421 | {0.174449,0.279335} |
d | -0.0781203 | 0.00540372 | {-0.0888783,-0.0673624} |
e | 0.498907 | 0.034922 | {0.429382,0.568431} |
a+bL+c++,
,
,0.998444,0.00863294
2
d
2
eta
e
L
2Log[L]
Log[10]
Estimate | Standard Error | t-Statistic | P-Value | |
a | -0.28802 | 0.0486649 | -5.91845 | 8.22163× -8 10 |
b | -0.180476 | 0.0200492 | -9.00164 | 1.07124× -13 10 |
c | 0.193123 | 0.0340806 | 5.66663 | 2.34474× -7 10 |
d | 0.0743133 | 0.0045574 | 16.3061 | 7.589× -27 10 |
e | 2.05741 | 0.0612655 | 33.582 | 3.90234× -48 10 |
Estimate | Standard Error | Confidence Interval | |
a | -0.28802 | 0.0486649 | {-0.384905,-0.191136} |
b | -0.180476 | 0.0200492 | {-0.220391,-0.140561} |
c | 0.193123 | 0.0340806 | {0.125273,0.260972} |
d | 0.0743133 | 0.0045574 | {0.0652403,0.0833864} |
e | 2.05741 | 0.0612655 | {1.93544,2.17938} |
 ,
, ,
, ,
, ,
,
RandomSearch
{ParameterTable,ParameterConfidenceIntervalTable,RSquared,EstimatedVariance}
a,
,
,0.997471,0.0138501
c
(+)
2
b
2
eta
d
L
Estimate | Standard Error | t-Statistic | P-Value | |
a | 0.391754 | 0.054331 | 7.2105 | 2.94986× -10 10 |
b | -0.0691227 | 0.00599556 | -11.529 | 1.32613× -18 10 |
c | 0.48635 | 0.0399594 | 12.1711 | 8.40939× -20 10 |
d | 1.72996 | 0.0253849 | 68.1492 | 6.00967× -72 10 |
Estimate | Standard Error | Confidence Interval | |
a | 0.391754 | 0.054331 | {0.283611,0.499897} |
b | -0.0691227 | 0.00599556 | {-0.0810566,-0.0571888} |
c | 0.48635 | 0.0399594 | {0.406813,0.565887} |
d | 1.72996 | 0.0253849 | {1.67943,1.78048} |
a+c,
,
,0.997537,0.0136638
b
(+)
2
d
2
eta
e
L
Estimate | Standard Error | t-Statistic | P-Value | |
a | 0.0624266 | 0.0408904 | 1.52668 | 0.130886 |
b | 0.503601 | 0.042616 | 11.8172 | 4.64844× -19 10 |
c | 0.351986 | 0.0552755 | 6.36784 | 1.22231× -8 10 |
d | -0.0693731 | 0.00594121 | -11.6766 | 8.47497× -19 10 |
e | 1.79482 | 0.0500079 | 35.8907 | 2.98057× -50 10 |
Estimate | Standard Error | Confidence Interval | |
a | 0.0624266 | 0.0408904 | {-0.01898,0.143833} |
b | 0.503601 | 0.042616 | {0.418759,0.588443} |
c | 0.351986 | 0.0552755 | {0.24194,0.462031} |
d | -0.0693731 | 0.00594121 | {-0.0812011,-0.057545} |
e | 1.79482 | 0.0500079 | {1.69526,1.89438} |
a+bL+c++,
,
,0.998427,0.00861757
2
d
2
eta
2
L
2Log[L]
Log[10]
Estimate | Standard Error | t-Statistic | P-Value | |
a | -0.269325 | 0.0448594 | -6.00376 | 5.55488× -8 10 |
b | -0.19654 | 0.0118853 | -16.5364 | 2.2441× -27 10 |
c | 0.227705 | 0.00430755 | 52.8618 | 2.02974× -63 10 |
d | 0.0782754 | 0.00201424 | 38.8609 | 2.96869× -53 10 |
Estimate | Standard Error | Confidence Interval | |
a | -0.269325 | 0.0448594 | {-0.358615,-0.180035} |
b | -0.19654 | 0.0118853 | {-0.220198,-0.172883} |
c | 0.227705 | 0.00430755 | {0.219131,0.236279} |
d | 0.0782754 | 0.00201424 | {0.0742661,0.0822846} |
a+bL+c+,
,
,0.998427,0.00872793
e
(+)
2
d
2
eta
2
L
2Log[L]
Log[10]
Estimate | Standard Error | t-Statistic | P-Value | |
a | -0.26912 | 0.0454986 | -5.91492 | 8.34403× -8 10 |
b | -0.196593 | 0.0120473 | -16.3185 | 7.24686× -27 10 |
c | 0.226895 | 0.0263429 | 8.61316 | 6.08133× -13 10 |
d | -0.0781209 | 0.00540377 | -14.4568 | 9.03229× -24 10 |
e | 0.498911 | 0.0349225 | 14.2862 | 1.7738× -23 10 |
Estimate | Standard Error | Confidence Interval | |
a | -0.26912 | 0.0454986 | {-0.359701,-0.17854} |
b | -0.196593 | 0.0120473 | {-0.220578,-0.172609} |
c | 0.226895 | 0.0263429 | {0.174451,0.27934} |
d | -0.0781209 | 0.00540377 | {-0.088879,-0.0673628} |
e | 0.498911 | 0.0349225 | {0.429386,0.568437} |
a+bL+c++,
,
,0.998444,0.00863294
2
d
2
eta
e
L
2Log[L]
Log[10]
Estimate | Standard Error | t-Statistic | P-Value | |
a | -0.288022 | 0.0486649 | -5.91847 | 8.22067× -8 10 |
b | -0.180475 | 0.0200492 | -9.00164 | 1.07127× -13 10 |
c | 0.193122 | 0.0340806 | 5.66663 | 2.34473× -7 10 |
d | 0.0743133 | 0.00455739 | 16.3061 | 7.58905× -27 10 |
e | 2.05742 | 0.0612655 | 33.582 | 3.90226× -48 10 |
Estimate | Standard Error | Confidence Interval | |
a | -0.288022 | 0.0486649 | {-0.384906,-0.191137} |
b | -0.180475 | 0.0200492 | {-0.22039,-0.14056} |
c | 0.193122 | 0.0340806 | {0.125273,0.260971} |
d | 0.0743133 | 0.00455739 | {0.0652402,0.0833863} |
e | 2.05742 | 0.0612655 | {1.93544,2.17939} |
 ,
, ,
, ,
, ,
,
NelderMead
{ParameterTable,ParameterConfidenceIntervalTable,RSquared,EstimatedVariance}
a,
,
,0.997471,0.0138501
c
(+)
2
b
2
eta
d
L
Estimate | Standard Error | t-Statistic | P-Value | |
a | 0.391754 | 0.0543312 | 7.21048 | 2.95004× -10 10 |
b | 0.0691228 | 0.00599556 | 11.529 | 1.32607× -18 10 |
c | 0.486351 | 0.0399595 | 12.1711 | 8.40935× -20 10 |
d | 1.72996 | 0.0253849 | 68.1492 | 6.00955× -72 10 |
Estimate | Standard Error | Confidence Interval | |
a | 0.391754 | 0.0543312 | {0.28361,0.499897} |
b | 0.0691228 | 0.00599556 | {0.0571889,0.0810567} |
c | 0.486351 | 0.0399595 | {0.406814,0.565889} |
d | 1.72996 | 0.0253849 | {1.67943,1.78049} |
a+c,
,
,0.997537,0.0136638
b
(+)
2
d
2
eta
e
L
Estimate | Standard Error | t-Statistic | P-Value | |
a | 0.0624269 | 0.0408904 | 1.52669 | 0.130884 |
b | 0.503592 | 0.0426147 | 11.8173 | 4.64523× -19 10 |
c | 0.351975 | 0.0552729 | 6.36796 | 1.22169× -8 10 |
d | 0.0693718 | 0.00594108 | 11.6766 | 8.47333× -19 10 |
e | 1.79482 | 0.0500079 | 35.8907 | 2.98068× -50 10 |
Estimate | Standard Error | Confidence Interval | |
a | 0.0624269 | 0.0408904 | {-0.0189797,0.143833} |
b | 0.503592 | 0.0426147 | {0.418753,0.588431} |
c | 0.351975 | 0.0552729 | {0.241936,0.462015} |
d | 0.0693718 | 0.00594108 | {0.057544,0.0811996} |
e | 1.79482 | 0.0500079 | {1.69526,1.89438} |
a+bL+c++,
,
,0.998427,0.00861757
2
d
2
eta
2
L
2Log[L]
Log[10]
Estimate | Standard Error | t-Statistic | P-Value | |
a | -0.269319 | 0.0448594 | -6.00363 | 5.558× -8 10 |
b | -0.196542 | 0.0118853 | -16.5366 | 2.243× -27 10 |
c | 0.227705 | 0.00430755 | 52.8619 | 2.0294× -63 10 |
d | -0.0782756 | 0.00201424 | -38.8611 | 2.96751× -53 10 |
Estimate | Standard Error | Confidence Interval | |
a | -0.269319 | 0.0448594 | {-0.358609,-0.180029} |
b | -0.196542 | 0.0118853 | {-0.220199,-0.172885} |
c | 0.227705 | 0.00430755 | {0.219132,0.236279} |
d | -0.0782756 | 0.00201424 | {-0.0822849,-0.0742664} |
a+bL+c+,
,
,0.998427,0.00872793
e
(+)
2
d
2
eta
2
L
2Log[L]
Log[10]
Estimate | Standard Error | t-Statistic | P-Value | |
a | -0.269123 | 0.0454986 | -5.91498 | 8.34199× -8 10 |
b | -0.196593 | 0.0120473 | -16.3185 | 7.24805× -27 10 |
c | 0.226892 | 0.0263422 | 8.61325 | 6.07893× -13 10 |
d | -0.0781203 | 0.00540372 | -14.4568 | 9.03175× -24 10 |
e | 0.498908 | 0.0349221 | 14.2863 | 1.77327× -23 10 |
Estimate | Standard Error | Confidence Interval | |
a | -0.269123 | 0.0454986 | {-0.359704,-0.178542} |
b | -0.196593 | 0.0120473 | {-0.220577,-0.172609} |
c | 0.226892 | 0.0263422 | {0.174449,0.279336} |
d | -0.0781203 | 0.00540372 | {-0.0888783,-0.0673623} |
e | 0.498908 | 0.0349221 | {0.429383,0.568432} |
a+bL+c++,
,
,0.938795,0.339509
2
d
2
eta
e
L
2Log[L]
Log[10]
Estimate | Standard Error | t-Statistic | P-Value | |
a | 61.1881 | 5461.34 | 0.0112039 | 0.991089 |
b | 0.346915 | 0.334634 | 1.0367 | 0.303079 |
c | -0.261002 | 2065.83 | -0.000126342 | 0.9999 |
d | -236.031 | 1.8663× 6 10 | -0.00012647 | 0.999899 |
e | 0.0192735 | 1.68473 | 0.0114401 | 0.990902 |
Estimate | Standard Error | Confidence Interval | |
a | 61.1881 | 5461.34 | {-10811.5,10933.9} |
b | 0.346915 | 0.334634 | {-0.31929,1.01312} |
c | -0.261002 | 2065.83 | {-4113.01,4112.49} |
d | -236.031 | 1.8663× 6 10 | -3.71575× 6 10 6 10 |
e | 0.0192735 | 1.68473 | {-3.33476,3.37331} |
 ,
, ,
, ,
, ,
,
DifferentialEvolution
{ParameterTable,ParameterConfidenceIntervalTable,RSquared,EstimatedVariance}
a,
,
,0.997471,0.0138501
c
(+)
2
b
2
eta
d
L
Estimate | Standard Error | t-Statistic | P-Value | |
a | 0.39176 | 0.0543327 | 7.2104 | 2.95118× -10 10 |
b | 0.0691234 | 0.00599563 | 11.529 | 1.3262× -18 10 |
c | 0.486356 | 0.0399602 | 12.171 | 8.41254× -20 10 |
d | 1.72996 | 0.0253849 | 68.1492 | 6.00958× -72 10 |
Estimate | Standard Error | Confidence Interval | |
a | 0.39176 | 0.0543327 | {0.283614,0.499907} |
b | 0.0691234 | 0.00599563 | {0.0571894,0.0810574} |
c | 0.486356 | 0.0399602 | {0.406817,0.565894} |
d | 1.72996 | 0.0253849 | {1.67943,1.78049} |
a+c,
,
,0.997537,0.0136638
b
(+)
2
d
2
eta
e
L
Estimate | Standard Error | t-Statistic | P-Value | |
a | 0.0624324 | 0.0408902 | 1.52683 | 0.130849 |
b | 0.503608 | 0.0426168 | 11.8171 | 4.6498× -19 10 |
c | 0.351987 | 0.0552765 | 6.36776 | 1.22272× -8 10 |
d | -0.0693738 | 0.00594128 | -11.6766 | 8.47522× -19 10 |
e | 1.79483 | 0.0500081 | 35.8907 | 2.98022× -50 10 |
Estimate | Standard Error | Confidence Interval | |
a | 0.0624324 | 0.0408902 | {-0.0189738,0.143839} |
b | 0.503608 | 0.0426168 | {0.418764,0.588452} |
c | 0.351987 | 0.0552765 | {0.24194,0.462034} |
d | -0.0693738 | 0.00594128 | {-0.081202,-0.0575456} |
e | 1.79483 | 0.0500081 | {1.69527,1.89438} |
a+bL+c++,
,
,0.998427,0.00861757
2
d
2
eta
2
L
2Log[L]
Log[10]
Estimate | Standard Error | t-Statistic | P-Value | |
a | -0.269324 | 0.0448594 | -6.00374 | 5.55533× -8 10 |
b | -0.196541 | 0.0118853 | -16.5365 | 2.24394× -27 10 |
c | 0.227705 | 0.00430755 | 52.8618 | 2.0297× -63 10 |
d | 0.0782754 | 0.00201424 | 38.861 | 2.9685× -53 10 |
Estimate | Standard Error | Confidence Interval | |
a | -0.269324 | 0.0448594 | {-0.358614,-0.180034} |
b | -0.196541 | 0.0118853 | {-0.220198,-0.172884} |
c | 0.227705 | 0.00430755 | {0.219131,0.236279} |
d | 0.0782754 | 0.00201424 | {0.0742662,0.0822847} |
a+bL+c+,
,
,0.998427,0.00872793
e
(+)
2
d
2
eta
2
L
2Log[L]
Log[10]
Estimate | Standard Error | t-Statistic | P-Value | |
a | -0.269125 | 0.0454986 | -5.91503 | 8.34035× -8 10 |
b | -0.196592 | 0.0120473 | -16.3184 | 7.24957× -27 10 |
c | 0.226902 | 0.0263443 | 8.61295 | 6.08728× -13 10 |
d | -0.0781221 | 0.00540387 | -14.4567 | 9.03476× -24 10 |
e | 0.49892 | 0.0349236 | 14.2861 | 1.7751× -23 10 |
Estimate | Standard Error | Confidence Interval | |
a | -0.269125 | 0.0454986 | {-0.359706,-0.178544} |
b | -0.196592 | 0.0120473 | {-0.220576,-0.172608} |
c | 0.226902 | 0.0263443 | {0.174454,0.279349} |
d | -0.0781221 | 0.00540387 | {-0.0888803,-0.0673638} |
e | 0.49892 | 0.0349236 | {0.429393,0.568448} |
a+bL+c++,
,
,0.998444,0.00863294
2
d
2
eta
e
L
2Log[L]
Log[10]
Estimate | Standard Error | t-Statistic | P-Value | |
a | -0.28802 | 0.048665 | -5.91842 | 8.22236× -8 10 |
b | -0.180477 | 0.0200493 | -9.00164 | 1.07124× -13 10 |
c | 0.193125 | 0.034081 | 5.66663 | 2.34472× -7 10 |
d | -0.0743136 | 0.00455742 | -16.3061 | 7.58932× -27 10 |
e | 2.05741 | 0.0612654 | 33.5819 | 3.90267× -48 10 |
Estimate | Standard Error | Confidence Interval | |
a | -0.28802 | 0.048665 | {-0.384904,-0.191135} |
b | -0.180477 | 0.0200493 | {-0.220392,-0.140562} |
c | 0.193125 | 0.034081 | {0.125275,0.260975} |
d | -0.0743136 | 0.00455742 | {-0.0833867,-0.0652405} |
e | 2.05741 | 0.0612654 | {1.93544,2.17938} |
 ,
, ,
, ,
, ,
,
TTS vs. L Fit with Squared Parameters
TTS vs. L Fit with Squared Parameters
C
C
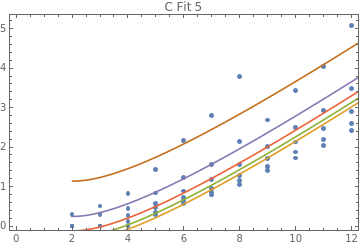
For[i=1,i≤Length[method],i++,Print[method[[i]]];Print[resultsCsqL[i][[1]][[1]]];Print[resultsCsqL[i][[1]][[2;;3]]];Print[resultsCsqL[i][[1]][[4;;5]]];Print[resultsCsqL[i][[1]][[6;;7]]];Print[resultsCsqL[i][[1]][[8;;9]]];Print[resultsCsqL[i][[1]][[10;;11]]];Print[Table[Show[ListPlot[LdataC],Plot[{gCsqL[i,j,L,0.0][[2]],gCsqL[i,j,L,0.03][[2]],gCsqL[i,j,L,0.05][[2]],gCsqL[i,j,L,0.07][[2]],gCsqL[i,j,L,0.10][[2]],gCsqL[i,j,L,0.15][[2]]},{L,2,16}],FrameTrue,PlotLabel"C Fit "<>ToString[j]],{j,1,5}]];]
SimulatedAnnealing
{ParameterTable,ParameterConfidenceIntervalTable,RSquared,EstimatedVariance}
,
,
,0.997726,0.00780359
2
a
2
c
(+)
2
b
2
eta
2
d
L
Estimate | Standard Error | t-Statistic | P-Value | |
a | -2.83037 | 0.757778 | -3.7351 | 0.000430245 |
b | -0.133849 | 0.0126568 | -10.5753 | 3.74905× -15 10 |
c | 1.26757 | 0.0842335 | 15.0482 | 1.09468× -21 10 |
d | 1.45691 | 0.0112789 | 129.171 | 4.64772× -73 10 |
Estimate | Standard Error | Confidence Interval | |
a | -2.83037 | 0.757778 | {-4.34723,-1.31352} |
b | -0.133849 | 0.0126568 | {-0.159184,-0.108514} |
c | 1.26757 | 0.0842335 | {1.09896,1.43618} |
d | 1.45691 | 0.0112789 | {1.43433,1.47948} |
+,
,
,0.997726,0.0079405
2
a
2
c
2
b
(+)
2
d
2
eta
2
e
L
Estimate | Standard Error | t-Statistic | P-Value | |
a | 1.05759× -8 10 | 1.46769× 6 10 | 7.20579× -15 10 | 1 |
b | 1.26753 | 0.0895688 | 14.1515 | 2.63634× -20 10 |
c | 2.83007 | 0.777704 | 3.639 | 0.000590676 |
d | -0.133844 | 0.0130284 | -10.2733 | 1.38685× -14 10 |
e | 1.4569 | 0.0193598 | 75.254 | 9.56065× -59 10 |
Estimate | Standard Error | Confidence Interval | |
a | 1.05759× -8 10 | 1.46769× 6 10 | -2.93901× 6 10 6 10 |
b | 1.26753 | 0.0895688 | {1.08817,1.44689} |
c | 2.83007 | 0.777704 | {1.27274,4.38739} |
d | -0.133844 | 0.0130284 | {-0.159933,-0.107755} |
e | 1.4569 | 0.0193598 | {1.41814,1.49567} |
+L+++,
,
,0.820003,0.617672
2
a
2
b
2
c
2
d
2
eta
2
L
2Log[L]
Log[10]
Estimate | Standard Error | t-Statistic | P-Value | |
a | 0.000048291 | 2723.24 | 1.77329× -8 10 | 1 |
b | 0.0000154568 | 1808.62 | 8.54621× -9 10 | 1 |
c | 0.308827 | 0.0843229 | 3.66243 | 0.000542177 |
d | -3.39059× -9 10 | 0.0511174 | -6.63295× -8 10 | 1. |
Estimate | Standard Error | Confidence Interval | |
a | 0.000048291 | 2723.24 | {-5451.15,5451.15} |
b | 0.0000154568 | 1808.62 | {-3620.35,3620.35} |
c | 0.308827 | 0.0843229 | {0.140036,0.477618} |
d | -3.39059× -9 10 | 0.0511174 | {-0.102323,0.102323} |
+L++,
,
,0.837064,0.568933
2
a
2
b
2
c
2
e
(+)
2
d
2
eta
2
L
2Log[L]
Log[10]
Estimate | Standard Error | t-Statistic | P-Value | |
a | -7.08862× -9 10 | 1.78414× 7 10 | -3.97313× -16 10 | 1 |
b | -7.42781× -9 10 | 3.27815× 6 10 | -2.26585× -15 10 | 1 |
c | 1.38611 | 1.79489 | 0.772255 | 0.443154 |
d | -7.38505× -9 10 | 380030. | -1.94328× -14 10 | 1 |
e | 1.06034 | 0.3204 | 3.30941 | 0.00162452 |
Estimate | Standard Error | Confidence Interval | |
a | -7.08862× -9 10 | 1.78414× 7 10 | -3.57268× 7 10 7 10 |
b | -7.42781× -9 10 | 3.27815× 6 10 | -6.56438× 6 10 6 10 |
c | 1.38611 | 1.79489 | {-2.20809,4.98031} |
d | -7.38505× -9 10 | 380030. | {-760996.,760996.} |
e | 1.06034 | 0.3204 | {0.418746,1.70193} |
+L+++,
,
,0.848445,0.529195
2
a
2
b
2
c
2
d
2
eta
2
e
L
2Log[L]
Log[10]
Estimate | Standard Error | t-Statistic | P-Value | |
a | 0.000109305 | 1258.88 | 8.68269× -8 10 | 1 |
b | -2.53112× -6 10 | 10453.8 | -2.42124× -10 10 | 1 |
c | 0.0083854 | 0.0239682 | 0.349855 | 0.727737 |
d | -3.34724× -9 10 | 0.0322959 | -1.03643× -7 10 | 1. |
e | 2.26442 | 0.503615 | 4.49634 | 0.0000344293 |
Estimate | Standard Error | Confidence Interval | |
a | 0.000109305 | 1258.88 | {-2520.87,2520.87} |
b | -2.53112× -6 10 | 10453.8 | {-20933.4,20933.4} |
c | 0.0083854 | 0.0239682 | {-0.0396101,0.0563809} |
d | -3.34724× -9 10 | 0.0322959 | {-0.0646715,0.0646715} |
e | 2.26442 | 0.503615 | {1.25595,3.27289} |
 ,
, ,
, ,
, ,
,
RandomSearch
{ParameterTable,ParameterConfidenceIntervalTable,RSquared,EstimatedVariance}
,
,
,0.997726,0.00780359
2
a
2
c
(+)
2
b
2
eta
2
d
L
Estimate | Standard Error | t-Statistic | P-Value | |
a | 2.83107 | 0.7581 | 3.73442 | 0.000431173 |
b | 0.13386 | 0.0126586 | 10.5747 | 3.75747× -15 10 |
c | -1.26765 | 0.0842469 | -15.0468 | 1.09957× -21 10 |
d | 1.45691 | 0.011279 | 129.171 | 4.6477× -73 10 |
Estimate | Standard Error | Confidence Interval | |
a | 2.83107 | 0.7581 | {1.31356,4.34857} |
b | 0.13386 | 0.0126586 | {0.108521,0.159199} |
c | -1.26765 | 0.0842469 | {-1.43628,-1.09901} |
d | 1.45691 | 0.011279 | {1.43433,1.47949} |
+,
,
,0.997726,0.0079405
2
a
2
c
2
b
(+)
2
d
2
eta
2
e
L
Estimate | Standard Error | t-Statistic | P-Value | |
a | 0.0000350494 | 442.861 | 7.9143× -8 10 | 1 |
b | -1.26766 | 0.0895923 | -14.1492 | 2.65513× -20 10 |
c | 2.83121 | 0.77826 | 3.63788 | 0.000592776 |
d | -0.133863 | 0.0130315 | -10.2722 | 1.39211× -14 10 |
e | 1.45692 | 0.0193599 | 75.2544 | 9.55814× -59 10 |
Estimate | Standard Error | Confidence Interval | |
a | 0.0000350494 | 442.861 | {-886.814,886.814} |
b | -1.26766 | 0.0895923 | {-1.44707,-1.08826} |
c | 2.83121 | 0.77826 | {1.27277,4.38965} |
d | -0.133863 | 0.0130315 | {-0.159958,-0.107768} |
e | 1.45692 | 0.0193599 | {1.41815,1.49568} |
+L+++,
,
,0.820003,0.617672
2
a
2
b
2
c
2
d
2
eta
2
L
2Log[L]
Log[10]
Estimate | Standard Error | t-Statistic | P-Value | |
a | 0.0000242496 | 5423.08 | 4.47156× -9 10 | 1 |
b | 3.34685× -6 10 | 8352.81 | 4.00685× -10 10 | 1 |
c | 0.308817 | 0.0843257 | 3.66219 | 0.000542596 |
d | -1.10183× -11 10 | 0.0511208 | -2.15534× -10 10 | 1 |
Estimate | Standard Error | Confidence Interval | |
a | 0.0000242496 | 5423.08 | {-10855.5,10855.5} |
b | 3.34685× -6 10 | 8352.81 | {-16720.,16720.} |
c | 0.308817 | 0.0843257 | {0.14002,0.477613} |
d | -1.10183× -11 10 | 0.0511208 | {-0.102329,0.102329} |
+L++,
,
,0.837064,0.568933
2
a
2
b
2
c
2
e
(+)
2
d
2
eta
2
L
2Log[L]
Log[10]
Estimate | Standard Error | t-Statistic | P-Value | |
a | -7.93149× -9 10 | 1.59314× 7 10 | -4.97852× -16 10 | 1 |
b | 3.26556× -9 10 | 7.42951× 6 10 | 4.3954× -16 10 | 1 |
c | 1.38612 | 1.79365 | 0.77279 | 0.44284 |
d | 2.87112× -9 10 | 972795. | 2.95141× -15 10 | 1 |
e | -1.06034 | 0.32013 | -3.31221 | 0.001611 |
Estimate | Standard Error | Confidence Interval | |
a | -7.93149× -9 10 | 1.59314× 7 10 | -3.19021× 7 10 7 10 |
b | 3.26556× -9 10 | 7.42951× 6 10 | -1.48773× 7 10 7 10 |
c | 1.38612 | 1.79365 | {-2.20561,4.97784} |
d | 2.87112× -9 10 | 972795. | -1.94799× 6 10 6 10 |
e | -1.06034 | 0.32013 | {-1.70139,-0.419288} |
+L+++,
,
,0.848445,0.529195
2
a
2
b
2
c
2
d
2
eta
2
e
L
2Log[L]
Log[10]
Estimate | Standard Error | t-Statistic | P-Value | |
a | -0.0000141152 | 9748.54 | -1.44793× -9 10 | 1 |
b | -4.74178× -7 10 | 55797.7 | -8.49816× -12 10 | 1 |
c | 0.00834903 | 0.0238845 | 0.349559 | 0.727958 |
d | -5.31678× -10 10 | 0.0322875 | -1.6467× -8 10 | 1 |
e | 2.26522 | 0.503865 | 4.49569 | 0.0000345065 |
Estimate | Standard Error | Confidence Interval | |
a | -0.0000141152 | 9748.54 | {-19521.1,19521.1} |
b | -4.74178× -7 10 | 55797.7 | {-111733.,111733.} |
c | 0.00834903 | 0.0238845 | {-0.0394788,0.0561768} |
d | -5.31678× -10 10 | 0.0322875 | {-0.0646547,0.0646547} |
e | 2.26522 | 0.503865 | {1.25625,3.2742} |
 ,
, ,
, ,
, ,
,
NelderMead
{ParameterTable,ParameterConfidenceIntervalTable,RSquared,EstimatedVariance}
,
,
,0.88622,0.390445
2
a
2
c
(+)
2
b
2
eta
2
d
L
Estimate | Standard Error | t-Statistic | P-Value | |
a | 7.02699× -11 10 | 3.18425× -8 10 | 0.00220679 | 0.998247 |
b | 6.08782 | 22.6321 | 0.268991 | 0.788891 |
c | -3.47078 | 39.7064 | -0.087411 | 0.930646 |
d | 1.33493 | 0.0790374 | 16.8898 | 4.60503× -24 10 |
Estimate | Standard Error | Confidence Interval | |
a | 7.02699× -11 10 | 3.18425× -8 10 | -6.36695× -8 10 -8 10 |
b | 6.08782 | 22.6321 | {-39.2152,51.3908} |
c | -3.47078 | 39.7064 | {-82.9518,76.0102} |
d | 1.33493 | 0.0790374 | {1.17671,1.49314} |
+,
,
,0.997726,0.0079405
2
a
2
c
2
b
(+)
2
d
2
eta
2
e
L
Estimate | Standard Error | t-Statistic | P-Value | |
a | -1.04957× -6 10 | 14789. | -7.09693× -11 10 | 1 |
b | -1.26763 | 0.0895868 | -14.1498 | 2.65066× -20 10 |
c | 2.83097 | 0.778136 | 3.63814 | 0.000592288 |
d | -0.133859 | 0.0130308 | -10.2725 | 1.39084× -14 10 |
e | 1.45691 | 0.0193599 | 75.2542 | 9.5594× -59 10 |
Estimate | Standard Error | Confidence Interval | |
a | -1.04957× -6 10 | 14789. | {-29614.5,29614.5} |
b | -1.26763 | 0.0895868 | {-1.44703,-1.08824} |
c | 2.83097 | 0.778136 | {1.27278,4.38916} |
d | -0.133859 | 0.0130308 | {-0.159952,-0.107765} |
e | 1.45691 | 0.0193599 | {1.41814,1.49568} |
+L+++,
,
,0.820003,0.617673
2
a
2
b
2
c
2
d
2
eta
2
L
2Log[L]
Log[10]
Estimate | Standard Error | t-Statistic | P-Value | |
a | 0.000484399 | 271.487 | 1.78424× -6 10 | 0.999999 |
b | 0.0000840084 | 332.771 | 2.52451× -7 10 | 1. |
c | 0.308873 | 0.0843105 | 3.66351 | 0.000540323 |
d | -7.06897× -9 10 | 0.0511023 | -1.3833× -7 10 | 1. |
Estimate | Standard Error | Confidence Interval | |
a | 0.000484399 | 271.487 | {-543.439,543.44} |
b | 0.0000840084 | 332.771 | {-666.114,666.114} |
c | 0.308873 | 0.0843105 | {0.140107,0.477638} |
d | -7.06897× -9 10 | 0.0511023 | {-0.102292,0.102292} |
+L++,
,
,0.805834,0.677984
2
a
2
b
2
c
2
e
(+)
2
d
2
eta
2
L
2Log[L]
Log[10]
Estimate | Standard Error | t-Statistic | P-Value | |
a | -0.0603159 | 4.08729 | -0.0147569 | 0.988278 |
b | -0.0224405 | 3.47817 | -0.00645182 | 0.994875 |
c | 0.174284 | 0.180071 | 0.967864 | 0.337201 |
d | -5.48649× -13 10 | 0.0000121015 | -4.53374× -8 10 | 1 |
e | 0.555303 | 0.59182 | 0.938297 | 0.352051 |
Estimate | Standard Error | Confidence Interval | |
a | -0.0603159 | 4.08729 | {-8.24497,8.12434} |
b | -0.0224405 | 3.47817 | {-6.98735,6.94247} |
c | 0.174284 | 0.180071 | {-0.186301,0.534869} |
d | -5.48649× -13 10 | 0.0000121015 | {-0.0000242328,0.0000242328} |
e | 0.555303 | 0.59182 | {-0.629796,1.7404} |
+L+++,
,
,0.760885,0.834936
2
a
2
b
2
c
2
d
2
eta
2
e
L
2Log[L]
Log[10]
Estimate | Standard Error | t-Statistic | P-Value | |
a | 2.68181× -10 10 | 1.55175× 9 10 | 1.72825× -19 10 | 1 |
b | 0.0787623 | 0.236392 | 0.333186 | 0.740217 |
c | -1.87123× -8 10 | 1.32075× 8 10 | -1.41678× -16 10 | 1 |
d | -0.124936 | 1714.73 | -0.0000728602 | 0.999942 |
e | -0.241455 | 86.5395 | -0.00279011 | 0.997784 |
Estimate | Standard Error | Confidence Interval | |
a | 2.68181× -10 10 | 1.55175× 9 10 | -3.10732× 9 10 9 10 |
b | 0.0787623 | 0.236392 | {-0.394604,0.552128} |
c | -1.87123× -8 10 | 1.32075× 8 10 | -2.64477× 8 10 8 10 |
d | -0.124936 | 1714.73 | {-3433.82,3433.57} |
e | -0.241455 | 86.5395 | {-173.534,173.051} |
 ,
, ,
, ,
, ,
,
DifferentialEvolution
{ParameterTable,ParameterConfidenceIntervalTable,RSquared,EstimatedVariance}
,
,
,0.997726,0.00780359
2
a
2
c
(+)
2
b
2
eta
2
d
L
Estimate | Standard Error | t-Statistic | P-Value | |
a | -2.83098 | 0.758059 | -3.73451 | 0.000431055 |
b | 0.133859 | 0.0126584 | 10.5747 | 3.75642× -15 10 |
c | 1.26764 | 0.0842452 | 15.047 | 1.09896× -21 10 |
d | 1.45691 | 0.0112789 | 129.171 | 4.64769× -73 10 |
Estimate | Standard Error | Confidence Interval | |
a | -2.83098 | 0.758059 | {-4.3484,-1.31356} |
b | 0.133859 | 0.0126584 | {0.10852,0.159197} |
c | 1.26764 | 0.0842452 | {1.099,1.43627} |
d | 1.45691 | 0.0112789 | {1.43433,1.47949} |
+,
,
,0.997726,0.0079405
2
a
2
c
2
b
(+)
2
d
2
eta
2
e
L
Estimate | Standard Error | t-Statistic | P-Value | |
a | 9.78891× -9 10 | 1.58568× 6 10 | 6.17333× -15 10 | 1 |
b | 1.26764 | 0.0895871 | 14.1498 | 2.65085× -20 10 |
c | 2.83098 | 0.778142 | 3.63812 | 0.000592311 |
d | 0.133859 | 0.0130308 | 10.2725 | 1.3909× -14 10 |
e | 1.45691 | 0.0193599 | 75.2542 | 9.55923× -59 10 |
Estimate | Standard Error | Confidence Interval | |
a | 9.78891× -9 10 | 1.58568× 6 10 | -3.17527× 6 10 6 10 |
b | 1.26764 | 0.0895871 | {1.08824,1.44703} |
c | 2.83098 | 0.778142 | {1.27277,4.38918} |
d | 0.133859 | 0.0130308 | {0.107765,0.159953} |
e | 1.45691 | 0.0193599 | {1.41814,1.49568} |
+L+++,
,
,0.820003,0.617672
2
a
2
b
2
c
2
d
2
eta
2
L
2Log[L]
Log[10]
Estimate | Standard Error | t-Statistic | P-Value | |
a | -8.72477× -9 10 | 1.50729× 7 10 | -5.78838× -16 10 | 1 |
b | 1.2657× -8 10 | 2.2087× 6 10 | 5.73054× -15 10 | 1 |
c | 0.308816 | 0.084326 | 3.66216 | 0.00054264 |
d | 8.8199× -16 10 | 0.0511211 | 1.72529× -14 10 | 1 |
Estimate | Standard Error | Confidence Interval | |
a | -8.72477× -9 10 | 1.50729× 7 10 | -3.01717× 7 10 7 10 |
b | 1.2657× -8 10 | 2.2087× 6 10 | -4.42119× 6 10 6 10 |
c | 0.308816 | 0.084326 | {0.140019,0.477612} |
d | 8.8199× -16 10 | 0.0511211 | {-0.10233,0.10233} |
+L++,
,
,0.837064,0.568933
2
a
2
b
2
c
2
e
(+)
2
d
2
eta
2
L
2Log[L]
Log[10]
Estimate | Standard Error | t-Statistic | P-Value | |
a | -2.61408× -8 10 | 4.82988× 6 10 | -5.41231× -15 10 | 1 |
b | 1.07462× -9 10 | 2.2501× 7 10 | 4.77585× -17 10 | 1 |
c | -1.38611 | 1.79248 | -0.773293 | 0.442544 |
d | -9.0291× -10 10 | 3.07932× 6 10 | -2.93218× -16 10 | 1 |
e | -1.06034 | 0.319876 | -3.31483 | 0.0015984 |
Estimate | Standard Error | Confidence Interval | |
a | -2.61408× -8 10 | 4.82988× 6 10 | -9.67167× 6 10 6 10 |
b | 1.07462× -9 10 | 2.2501× 7 10 | -4.50576× 7 10 7 10 |
c | -1.38611 | 1.79248 | {-4.9755,2.20327} |
d | -9.0291× -10 10 | 3.07932× 6 10 | -6.16622× 6 10 6 10 |
e | -1.06034 | 0.319876 | {-1.70088,-0.419795} |
+L+++,
,
,0.848445,0.529195
2
a
2
b
2
c
2
d
2
eta
2
e
L
2Log[L]
Log[10]
Estimate | Standard Error | t-Statistic | P-Value | |
a | 4.46213× -8 10 | 3.0838× 6 10 | 1.44696× -14 10 | 1 |
b | -2.17607× -9 10 | 1.21587× 7 10 | -1.78973× -16 10 | 1 |
c | -0.00834886 | 0.023884 | -0.349559 | 0.727958 |
d | -8.60393× -15 10 | 0.0322874 | -2.6648× -13 10 | 1 |
e | 2.26523 | 0.503864 | 4.49571 | 0.0000345045 |
Estimate | Standard Error | Confidence Interval | |
a | 4.46213× -8 10 | 3.0838× 6 10 | -6.1752× 6 10 6 10 |
b | -2.17607× -9 10 | 1.21587× 7 10 | -2.43473× 7 10 7 10 |
c | -0.00834886 | 0.023884 | {-0.0561757,0.039478} |
d | -8.60393× -15 10 | 0.0322874 | {-0.0646543,0.0646543} |
e | 2.26523 | 0.503864 | {1.25626,3.2742} |
 ,
, ,
, ,
, ,
,
QAC
QAC
For[i=1,i≤Length[method],i++,Print[method[[i]]];Print[resultsQACsqL[i][[1]][[1]]];Print[resultsQACsqL[i][[1]][[2;;3]]];Print[resultsQACsqL[i][[1]][[4;;5]]];Print[resultsQACsqL[i][[1]][[6;;7]]];Print[resultsQACsqL[i][[1]][[8;;9]]];Print[resultsQACsqL[i][[1]][[10;;11]]];Print[Table[Show[ListPlot[LdataQAC],Plot[{gQACsqL[i,j,L,0.0][[2]],gQACsqL[i,j,L,0.03][[2]],gQACsqL[i,j,L,0.05][[2]],gQACsqL[i,j,L,0.07][[2]],gQACsqL[i,j,L,0.10][[2]],gQACsqL[i,j,L,0.15][[2]]},{L,2,16}],FrameTrue,PlotLabel"QAC Fit "<>ToString[j]],{j,1,5}]];]
SimulatedAnnealing
{ParameterTable,ParameterConfidenceIntervalTable,RSquared,EstimatedVariance}
,
,
,0.997471,0.0138501
2
a
2
c
(+)
2
b
2
eta
2
d
L
Estimate | Standard Error | t-Statistic | P-Value | |
a | 0.625894 | 0.0434008 | 14.4213 | 7.78366× -24 10 |
b | 0.0691217 | 0.00599544 | 11.529 | 1.32586× -18 10 |
c | 0.697383 | 0.0286488 | 24.3425 | 1.83954× -38 10 |
d | 1.31528 | 0.00965 | 136.298 | 1.62687× -95 10 |
Estimate | Standard Error | Confidence Interval | |
a | 0.625894 | 0.0434008 | {0.539507,0.712281} |
b | 0.0691217 | 0.00599544 | {0.057188,0.0810553} |
c | 0.697383 | 0.0286488 | {0.640359,0.754407} |
d | 1.31528 | 0.00965 | {1.29607,1.33449} |
+,
,
,0.997537,0.0136638
2
a
2
c
2
b
(+)
2
d
2
eta
2
e
L
Estimate | Standard Error | t-Statistic | P-Value | |
a | -0.249881 | 0.0818186 | -3.05409 | 0.00308785 |
b | 0.709649 | 0.0300259 | 23.6346 | 2.64989× -37 10 |
c | 0.59327 | 0.0465832 | 12.7357 | 9.69749× -21 10 |
d | -0.0693726 | 0.00594115 | -11.6766 | 8.47325× -19 10 |
e | -1.33972 | 0.0186638 | -71.7817 | 5.31898× -73 10 |
Estimate | Standard Error | Confidence Interval | |
a | -0.249881 | 0.0818186 | {-0.41277,-0.0869931} |
b | 0.709649 | 0.0300259 | {0.649872,0.769426} |
c | 0.59327 | 0.0465832 | {0.50053,0.68601} |
d | -0.0693726 | 0.00594115 | {-0.0812005,-0.0575447} |
e | -1.33972 | 0.0186638 | {-1.37687,-1.30256} |
+L+++,
,
,0.923928,0.416635
2
a
2
b
2
c
2
d
2
eta
2
L
2Log[L]
Log[10]
Estimate | Standard Error | t-Statistic | P-Value | |
a | -7.92074× -9 10 | 1.28047× 7 10 | -6.18578× -16 10 | 1 |
b | -8.32265× -9 10 | 2.60325× 6 10 | -3.19702× -15 10 | 1 |
c | 0.309173 | 0.0438379 | 7.05265 | 5.92531× -10 10 |
d | 0.0119357 | 0.0285105 | 0.418642 | 0.676614 |
Estimate | Standard Error | Confidence Interval | |
a | -7.92074× -9 10 | 1.28047× 7 10 | -2.54872× 7 10 7 10 |
b | -8.32265× -9 10 | 2.60325× 6 10 | -5.18164× 6 10 6 10 |
c | 0.309173 | 0.0438379 | {0.221916,0.39643} |
d | 0.0119357 | 0.0285105 | {-0.0448131,0.0686845} |
+L++,
,
,0.924849,0.416867
2
a
2
b
2
c
2
e
(+)
2
d
2
eta
2
L
2Log[L]
Log[10]
Estimate | Standard Error | t-Statistic | P-Value | |
a | -5.7222× -9 10 | 2.70951× 7 10 | -2.11189× -16 10 | 1 |
b | -8.10088× -9 10 | 5.04671× 6 10 | -1.60518× -15 10 | 1 |
c | -0.428831 | 0.197287 | -2.17364 | 0.0327657 |
d | -0.0225757 | 0.0483181 | -0.46723 | 0.641638 |
e | -0.803738 | 0.16463 | -4.88209 | 5.46139× -6 10 |
Estimate | Standard Error | Confidence Interval | |
a | -5.7222× -9 10 | 2.70951× 7 10 | -5.39422× 7 10 7 10 |
b | -8.10088× -9 10 | 5.04671× 6 10 | -1.00472× 7 10 7 10 |
c | -0.428831 | 0.197287 | {-0.821599,-0.0360628} |
d | -0.0225757 | 0.0483181 | {-0.11877,0.0736183} |
e | -0.803738 | 0.16463 | {-1.13149,-0.475986} |
+L+++,
,
,0.948133,0.287708
2
a
2
b
2
c
2
d
2
eta
2
e
L
2Log[L]
Log[10]
Estimate | Standard Error | t-Statistic | P-Value | |
a | 4.84076× -7 10 | 191347. | 2.52983× -12 10 | 1 |
b | 9.92672× -7 10 | 16099.3 | 6.16594× -11 10 | 1 |
c | 0.0181141 | 0.0170975 | 1.05946 | 0.292661 |
d | 0.0136872 | 0.0130293 | 1.05049 | 0.296736 |
e | -2.06612 | 0.168378 | -12.2708 | 6.79474× -20 10 |
Estimate | Standard Error | Confidence Interval | |
a | 4.84076× -7 10 | 191347. | {-380943.,380943.} |
b | 9.92672× -7 10 | 16099.3 | {-32051.2,32051.2} |
c | 0.0181141 | 0.0170975 | {-0.0159245,0.0521527} |
d | 0.0136872 | 0.0130293 | {-0.0122521,0.0396265} |
e | -2.06612 | 0.168378 | {-2.40134,-1.73091} |
 ,
, ,
, ,
, ,
,
RandomSearch
{ParameterTable,ParameterConfidenceIntervalTable,RSquared,EstimatedVariance}
,
,
,0.997471,0.0138501
2
a
2
c
(+)
2
b
2
eta
2
d
L
Estimate | Standard Error | t-Statistic | P-Value | |
a | 0.625911 | 0.0434036 | 14.4207 | 7.80152× -24 10 |
b | 0.0691238 | 0.00599566 | 11.529 | 1.32627× -18 10 |
c | -0.697393 | 0.0286499 | -24.3419 | 1.8426× -38 10 |
d | 1.31528 | 0.00964999 | 136.298 | 1.6269× -95 10 |
Estimate | Standard Error | Confidence Interval | |
a | 0.625911 | 0.0434036 | {0.539518,0.712304} |
b | 0.0691238 | 0.00599566 | {0.0571897,0.0810578} |
c | -0.697393 | 0.0286499 | {-0.75442,-0.640367} |
d | 1.31528 | 0.00964999 | {1.29607,1.33449} |
+,
,
,0.997537,0.0136638
2
a
2
c
2
b
(+)
2
d
2
eta
2
e
L
Estimate | Standard Error | t-Statistic | P-Value | |
a | 0.249856 | 0.0818279 | 3.05343 | 0.00309388 |
b | -0.709659 | 0.0300272 | -23.6339 | 2.65513× -37 10 |
c | 0.593297 | 0.0465868 | 12.7353 | 9.7136× -21 10 |
d | -0.0693751 | 0.00594142 | -11.6765 | 8.47736× -19 10 |
e | 1.33971 | 0.0186637 | 71.7814 | 5.32069× -73 10 |
Estimate | Standard Error | Confidence Interval | |
a | 0.249856 | 0.0818279 | {0.0869492,0.412763} |
b | -0.709659 | 0.0300272 | {-0.769438,-0.649879} |
c | 0.593297 | 0.0465868 | {0.50055,0.686044} |
d | -0.0693751 | 0.00594142 | {-0.0812036,-0.0575467} |
e | 1.33971 | 0.0186637 | {1.30255,1.37687} |
+L+++,
,
,0.923928,0.416635
2
a
2
b
2
c
2
d
2
eta
2
L
2Log[L]
Log[10]
Estimate | Standard Error | t-Statistic | P-Value | |
a | -6.63776× -9 10 | 1.52797× 7 10 | -4.34416× -16 10 | 1 |
b | -3.89091× -9 10 | 5.56834× 6 10 | -6.98755× -16 10 | 1 |
c | 0.309173 | 0.0438378 | 7.05265 | 5.9253× -10 10 |
d | 0.0119357 | 0.0285105 | 0.418642 | 0.676614 |
Estimate | Standard Error | Confidence Interval | |
a | -6.63776× -9 10 | 1.52797× 7 10 | -3.04135× 7 10 7 10 |
b | -3.89091× -9 10 | 5.56834× 6 10 | -1.10835× 7 10 7 10 |
c | 0.309173 | 0.0438378 | {0.221916,0.39643} |
d | 0.0119357 | 0.0285105 | {-0.0448131,0.0686845} |
+L++,
,
,0.924849,0.416867
2
a
2
b
2
c
2
e
(+)
2
d
2
eta
2
L
2Log[L]
Log[10]
Estimate | Standard Error | t-Statistic | P-Value | |
a | -3.68481× -9 10 | 4.20764× 7 10 | -8.75742× -17 10 | 1 |
b | 4.71359× -9 10 | 8.67339× 6 10 | 5.43455× -16 10 | 1 |
c | 0.42883 | 0.197286 | 2.17365 | 0.0327653 |
d | 0.0225755 | 0.048318 | 0.467228 | 0.641639 |
e | -0.803738 | 0.16463 | -4.88209 | 5.4615× -6 10 |
Estimate | Standard Error | Confidence Interval | |
a | -3.68481× -9 10 | 4.20764× 7 10 | -8.37677× 7 10 7 10 |
b | 4.71359× -9 10 | 8.67339× 6 10 | -1.72674× 7 10 7 10 |
c | 0.42883 | 0.197286 | {0.0360635,0.821596} |
d | 0.0225755 | 0.048318 | {-0.0736182,0.118769} |
e | -0.803738 | 0.16463 | {-1.13149,-0.475985} |
+L+++,
,
,0.948133,0.287708
2
a
2
b
2
c
2
d
2
eta
2
e
L
2Log[L]
Log[10]
Estimate | Standard Error | t-Statistic | P-Value | |
a | -5.99759× -7 10 | 154440. | -3.88345× -12 10 | 1 |
b | -7.09318× -7 10 | 22530.6 | -3.14824× -11 10 | 1 |
c | 0.0181153 | 0.0170985 | 1.05947 | 0.292657 |
d | -0.0136872 | 0.0130294 | -1.05049 | 0.296738 |
e | 2.06611 | 0.168377 | 12.2707 | 6.79577× -20 10 |
Estimate | Standard Error | Confidence Interval | |
a | -5.99759× -7 10 | 154440. | {-307466.,307466.} |
b | -7.09318× -7 10 | 22530.6 | {-44855.,44855.} |
c | 0.0181153 | 0.0170985 | {-0.0159252,0.0521557} |
d | -0.0136872 | 0.0130294 | {-0.0396268,0.0122523} |
e | 2.06611 | 0.168377 | {1.7309,2.40132} |
 ,
, ,
, ,
, ,
,
NelderMead
{ParameterTable,ParameterConfidenceIntervalTable,RSquared,EstimatedVariance}
,
,
,0.997471,0.0138501
2
a
2
c
(+)
2
b
2
eta
2
d
L
Estimate | Standard Error | t-Statistic | P-Value | |
a | 0.625908 | 0.0434032 | 14.4208 | 7.79906× -24 10 |
b | 0.0691235 | 0.00599563 | 11.529 | 1.3262× -18 10 |
c | 0.697392 | 0.0286497 | 24.342 | 1.84216× -38 10 |
d | 1.31528 | 0.00964999 | 136.298 | 1.62687× -95 10 |
Estimate | Standard Error | Confidence Interval | |
a | 0.625908 | 0.0434032 | {0.539516,0.7123} |
b | 0.0691235 | 0.00599563 | {0.0571895,0.0810575} |
c | 0.697392 | 0.0286497 | {0.640366,0.754418} |
d | 1.31528 | 0.00964999 | {1.29607,1.33449} |
+,
,
,0.997537,0.0136638
2
a
2
c
2
b
(+)
2
d
2
eta
2
e
L
Estimate | Standard Error | t-Statistic | P-Value | |
a | 0.249882 | 0.0818187 | 3.05409 | 0.00308788 |
b | -0.709656 | 0.0300266 | -23.6342 | 2.65259× -37 10 |
c | 0.593282 | 0.0465851 | 12.7355 | 9.70769× -21 10 |
d | -0.069374 | 0.00594129 | -11.6766 | 8.47509× -19 10 |
e | 1.33971 | 0.0186638 | 71.7816 | 5.31953× -73 10 |
Estimate | Standard Error | Confidence Interval | |
a | 0.249882 | 0.0818187 | {0.0869929,0.41277} |
b | -0.709656 | 0.0300266 | {-0.769434,-0.649877} |
c | 0.593282 | 0.0465851 | {0.500538,0.686026} |
d | -0.069374 | 0.00594129 | {-0.0812022,-0.0575458} |
e | 1.33971 | 0.0186638 | {1.30256,1.37687} |
+L+++,
,
,0.923928,0.416635
2
a
2
b
2
c
2
d
2
eta
2
L
2Log[L]
Log[10]
Estimate | Standard Error | t-Statistic | P-Value | |
a | -2.63343× -9 10 | 3.85137× 7 10 | -6.83763× -17 10 | 1 |
b | -6.98963× -9 10 | 3.09972× 6 10 | -2.25492× -15 10 | 1 |
c | 0.309173 | 0.0438378 | 7.05265 | 5.9253× -10 10 |
d | 0.0119357 | 0.0285105 | 0.418642 | 0.676614 |
Estimate | Standard Error | Confidence Interval | |
a | -2.63343× -9 10 | 3.85137× 7 10 | -7.66597× 7 10 7 10 |
b | -6.98963× -9 10 | 3.09972× 6 10 | -6.16984× 6 10 6 10 |
c | 0.309173 | 0.0438378 | {0.221916,0.39643} |
d | 0.0119357 | 0.0285105 | {-0.0448131,0.0686845} |
+L++,
,
,0.924849,0.416867
2
a
2
b
2
c
2
e
(+)
2
d
2
eta
2
L
2Log[L]
Log[10]
Estimate | Standard Error | t-Statistic | P-Value | |
a | -6.3938× -9 10 | 2.4249× 7 10 | -2.63672× -16 10 | 1 |
b | -6.58956× -9 10 | 6.20418× 6 10 | -1.06212× -15 10 | 1 |
c | 0.428829 | 0.197285 | 2.17365 | 0.0327651 |
d | -0.0225754 | 0.0483179 | -0.467227 | 0.64164 |
e | 0.803737 | 0.16463 | 4.88208 | 5.46162× -6 10 |
Estimate | Standard Error | Confidence Interval | |
a | -6.3938× -9 10 | 2.4249× 7 10 | -4.82761× 7 10 7 10 |
b | -6.58956× -9 10 | 6.20418× 6 10 | -1.23516× 7 10 7 10 |
c | 0.428829 | 0.197285 | {0.036064,0.821593} |
d | -0.0225754 | 0.0483179 | {-0.118769,0.0736181} |
e | 0.803737 | 0.16463 | {0.475984,1.13149} |
+L+++,
,
,0.862835,0.760861
2
a
2
b
2
c
2
d
2
eta
2
e
L
2Log[L]
Log[10]
Estimate | Standard Error | t-Statistic | P-Value | |
a | -1.19607× -9 10 | 1.0004× 9 10 | -1.19559× -18 10 | 1 |
b | -0.211219 | 0.058022 | -3.64032 | 0.00048767 |
c | -7.41552× -9 10 | 5.12731× 8 10 | -1.44628× -17 10 | 1 |
d | -0.290993 | 48.5472 | -0.00599404 | 0.995233 |
e | -0.183637 | 7.38033 | -0.024882 | 0.980213 |
Estimate | Standard Error | Confidence Interval | |
a | -1.19607× -9 10 | 1.0004× 9 10 | -1.99164× 9 10 9 10 |
b | -0.211219 | 0.058022 | {-0.326732,-0.0957059} |
c | -7.41552× -9 10 | 5.12731× 8 10 | -1.02077× 9 10 9 10 |
d | -0.290993 | 48.5472 | {-96.941,96.359} |
e | -0.183637 | 7.38033 | {-14.8767,14.5095} |
 ,
, ,
, ,
, ,
,
DifferentialEvolution
{ParameterTable,ParameterConfidenceIntervalTable,RSquared,EstimatedVariance}
,
,
,0.997471,0.0138501
2
a
2
c
(+)
2
b
2
eta
2
d
L
Estimate | Standard Error | t-Statistic | P-Value | |
a | 0.625908 | 0.0434031 | 14.4208 | 7.79889× -24 10 |
b | -0.0691234 | 0.00599563 | -11.529 | 1.3262× -18 10 |
c | -0.697392 | 0.0286497 | -24.342 | 1.84213× -38 10 |
d | 1.31528 | 0.00964999 | 136.298 | 1.62687× -95 10 |
Estimate | Standard Error | Confidence Interval | |
a | 0.625908 | 0.0434031 | {0.539516,0.712299} |
b | -0.0691234 | 0.00599563 | {-0.0810574,-0.0571894} |
c | -0.697392 | 0.0286497 | {-0.754418,-0.640366} |
d | 1.31528 | 0.00964999 | {1.29607,1.33449} |
+,
,
,0.997537,0.0136638
2
a
2
c
2
b
(+)
2
d
2
eta
2
e
L
Estimate | Standard Error | t-Statistic | P-Value | |
a | -0.249865 | 0.0818247 | -3.05366 | 0.00309182 |
b | 0.709653 | 0.0300265 | 23.6342 | 2.6524× -37 10 |
c | 0.593285 | 0.0465851 | 12.7355 | 9.70472× -21 10 |
d | 0.0693738 | 0.00594128 | 11.6766 | 8.47522× -19 10 |
e | 1.33971 | 0.0186637 | 71.7815 | 5.32013× -73 10 |
Estimate | Standard Error | Confidence Interval | |
a | -0.249865 | 0.0818247 | {-0.412765,-0.0869642} |
b | 0.709653 | 0.0300265 | {0.649875,0.769432} |
c | 0.593285 | 0.0465851 | {0.500542,0.686029} |
d | 0.0693738 | 0.00594128 | {0.0575456,0.081202} |
e | 1.33971 | 0.0186637 | {1.30255,1.37687} |
+L+++,
,
,0.923928,0.416635
2
a
2
b
2
c
2
d
2
eta
2
L
2Log[L]
Log[10]
Estimate | Standard Error | t-Statistic | P-Value | |
a | -4.89758× -9 10 | 2.07088× 7 10 | -2.36498× -16 10 | 1 |
b | 8.54475× -11 10 | 2.53558× 8 10 | 3.36994× -19 10 | 1 |
c | -0.309173 | 0.0438378 | -7.05266 | 5.92504× -10 10 |
d | 0.0119357 | 0.0285105 | 0.418642 | 0.676614 |
Estimate | Standard Error | Confidence Interval | |
a | -4.89758× -9 10 | 2.07088× 7 10 | -4.12198× 7 10 7 10 |
b | 8.54475× -11 10 | 2.53558× 8 10 | -5.04695× 8 10 8 10 |
c | -0.309173 | 0.0438378 | {-0.39643,-0.221916} |
d | 0.0119357 | 0.0285105 | {-0.0448131,0.0686845} |
+L++,
,
,0.924849,0.416867
2
a
2
b
2
c
2
e
(+)
2
d
2
eta
2
L
2Log[L]
Log[10]
Estimate | Standard Error | t-Statistic | P-Value | |
a | 5.23105× -9 10 | 2.96391× 7 10 | 1.76492× -16 10 | 1 |
b | 1.07266× -8 10 | 3.81136× 6 10 | 2.81436× -15 10 | 1 |
c | 0.42883 | 0.197286 | 2.17365 | 0.0327653 |
d | -0.0225755 | 0.048318 | -0.467228 | 0.641639 |
e | -0.803737 | 0.16463 | -4.88209 | 5.46152× -6 10 |
Estimate | Standard Error | Confidence Interval | |
a | 5.23105× -9 10 | 2.96391× 7 10 | -5.90069× 7 10 7 10 |
b | 1.07266× -8 10 | 3.81136× 6 10 | -7.58784× 6 10 6 10 |
c | 0.42883 | 0.197286 | {0.0360635,0.821596} |
d | -0.0225755 | 0.048318 | {-0.118769,0.0736182} |
e | -0.803737 | 0.16463 | {-1.13149,-0.475985} |
+L+++,
,
,0.948133,0.287708
2
a
2
b
2
c
2
d
2
eta
2
e
L
2Log[L]
Log[10]
Estimate | Standard Error | t-Statistic | P-Value | |
a | -4.35665× -9 10 | 2.1261× 7 10 | -2.04913× -16 10 | 1 |
b | 4.84032× -9 10 | 3.30173× 6 10 | 1.466× -15 10 | 1 |
c | 0.0181163 | 0.0170993 | 1.05948 | 0.292652 |
d | -0.0136872 | 0.0130295 | -1.05048 | 0.296742 |
e | 2.0661 | 0.168376 | 12.2707 | 6.79619× -20 10 |
Estimate | Standard Error | Confidence Interval | |
a | -4.35665× -9 10 | 2.1261× 7 10 | -4.23273× 7 10 7 10 |
b | 4.84032× -9 10 | 3.30173× 6 10 | -6.57324× 6 10 6 10 |
c | 0.0181163 | 0.0170993 | {-0.0159258,0.0521585} |
d | -0.0136872 | 0.0130295 | {-0.039627,0.0122525} |
e | 2.0661 | 0.168376 | {1.73089,2.40131} |
 ,
, ,
, ,
, ,
,
TTS vs. Effective L Fit with Unconstrained Parameters
TTS vs. Effective L Fit with Unconstrained Parameters
C
C
In[]:=
For[i=1,i≤Length[method],i++,Print[method[[i]]];Print[resultsCuncJ[i][[1]][[1]]];Print[resultsCuncJ[i][[1]][[2;;3]]];Print[resultsCuncJ[i][[1]][[4;;5]]];Print[resultsCuncJ[i][[1]][[6;;7]]];Print[resultsCuncJ[i][[1]][[8;;9]]];Print[resultsCuncJ[i][[1]][[10;;11]]];Print[Table[Show[ListPlot[JdataC],Plot[{gCuncJ[i,j,L,0.0][[2]],gCuncJ[i,j,L,0.03][[2]],gCuncJ[i,j,L,0.05][[2]],gCuncJ[i,j,L,0.07][[2]],gCuncJ[i,j,L,0.10][[2]],gCuncJ[i,j,L,0.15][[2]]},{L,Leffs[[1]],Leffs[[15]]}],FrameTrue,PlotLabel"C Fit "<>ToString[j]],{j,1,5}]];]
SimulatedAnnealing
{ParameterTable,ParameterConfidenceIntervalTable,RSquared,EstimatedVariance}
a,
,
,0.997715,0.00784102
c
(+)
2
b
2
eta
d
L
Estimate | Standard Error | t-Statistic | P-Value | |
a | 11.8547 | 6.76136 | 1.7533 | 0.0848333 |
b | 0.13741 | 0.013245 | 10.3745 | 7.80773× -15 10 |
c | 1.67571 | 0.229809 | 7.29174 | 9.47908× -10 10 |
d | 2.20342 | 0.0341326 | 64.5549 | 1.02497× -55 10 |
Estimate | Standard Error | Confidence Interval | |
a | 11.8547 | 6.76136 | {-1.67961,25.3891} |
b | 0.13741 | 0.013245 | {0.110897,0.163923} |
c | 1.67571 | 0.229809 | {1.21569,2.13572} |
d | 2.20342 | 0.0341326 | {2.1351,2.27175} |
a+c,
,
,0.998712,0.00449655
b
(+)
2
d
2
eta
e
L
Estimate | Standard Error | t-Statistic | P-Value | |
a | -0.172089 | 0.0274826 | -6.26173 | 5.34105× -8 10 |
b | 1.34249 | 0.133946 | 10.0226 | 3.46135× -14 10 |
c | 7.43664 | 2.4789 | 2.99998 | 0.00399914 |
d | 0.125325 | 0.00880788 | 14.2287 | 2.06776× -20 10 |
e | 1.96617 | 0.0415783 | 47.2884 | 1.9828× -47 10 |
Estimate | Standard Error | Confidence Interval | |
a | -0.172089 | 0.0274826 | {-0.227122,-0.117056} |
b | 1.34249 | 0.133946 | {1.07427,1.61071} |
c | 7.43664 | 2.4789 | {2.47273,12.4005} |
d | 0.125325 | 0.00880788 | {0.107687,0.142962} |
e | 1.96617 | 0.0415783 | {1.88291,2.04943} |
a+bL+c++,
,
,0.993574,0.0220512
2
d
2
eta
2
L
2Log[L]
Log[10]
Estimate | Standard Error | t-Statistic | P-Value | |
a | -0.138813 | 0.106034 | -1.30913 | 0.195653 |
b | -0.349122 | 0.0406902 | -8.58001 | 6.58267× -12 10 |
c | 0.539708 | 0.0201169 | 26.8286 | 2.18423× -34 10 |
d | -0.0722972 | 0.00450225 | -16.058 | 5.18658× -23 10 |
Estimate | Standard Error | Confidence Interval | |
a | -0.138813 | 0.106034 | {-0.351063,0.0734378} |
b | -0.349122 | 0.0406902 | {-0.430572,-0.267672} |
c | 0.539708 | 0.0201169 | {0.499439,0.579976} |
d | -0.0722972 | 0.00450225 | {-0.0813094,-0.0632849} |
a+bL+c+,
,
,0.998225,0.00619839
e
(+)
2
d
2
eta
2
L
2Log[L]
Log[10]
Estimate | Standard Error | t-Statistic | P-Value | |
a | -0.201592 | 0.0566561 | -3.55816 | 0.00076059 |
b | -0.337392 | 0.0217418 | -15.5181 | 3.99545× -22 10 |
c | 10.4684 | 5.75453 | 1.81915 | 0.074142 |
d | -0.166945 | 0.0177656 | -9.39706 | 3.492× -13 10 |
e | 1.55292 | 0.239574 | 6.482 | 2.30965× -8 10 |
Estimate | Standard Error | Confidence Interval | |
a | -0.201592 | 0.0566561 | {-0.315044,-0.0881397} |
b | -0.337392 | 0.0217418 | {-0.380929,-0.293854} |
c | 10.4684 | 5.75453 | {-1.05488,21.9916} |
d | -0.166945 | 0.0177656 | {-0.20252,-0.13137} |
e | 1.55292 | 0.239574 | {1.07318,2.03266} |
a+bL+c++,
,
,0.996806,0.0111531
2
d
2
eta
e
L
2Log[L]
Log[10]
Estimate | Standard Error | t-Statistic | P-Value | |
a | 0.121318 | 0.102368 | 1.18512 | 0.240888 |
b | -0.761393 | 0.10711 | -7.10853 | 2.09813× -9 10 |
c | 1.85233 | 0.308106 | 6.01199 | 1.37479× -7 10 |
d | 0.121039 | 0.0106148 | 11.4029 | 2.46057× -16 10 |
e | 1.54798 | 0.0556219 | 27.8305 | 7.29155× -35 10 |
Estimate | Standard Error | Confidence Interval | |
a | 0.121318 | 0.102368 | {-0.0836699,0.326306} |
b | -0.761393 | 0.10711 | {-0.975877,-0.54691} |
c | 1.85233 | 0.308106 | {1.23536,2.4693} |
d | 0.121039 | 0.0106148 | {0.0997837,0.142295} |
e | 1.54798 | 0.0556219 | {1.4366,1.65936} |
 ,
,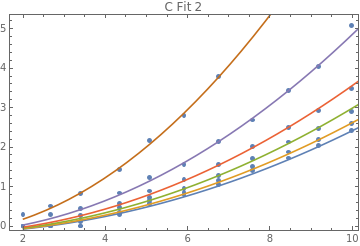 ,
, ,
, ,
,
RandomSearch
{ParameterTable,ParameterConfidenceIntervalTable,RSquared,EstimatedVariance}
a,
,
,0.997715,0.00784102
c
(+)
2
b
2
eta
d
L
Estimate | Standard Error | t-Statistic | P-Value | |
a | 11.8665 | 6.7705 | 1.75267 | 0.0849424 |
b | -0.137433 | 0.0132489 | -10.3732 | 7.84592× -15 10 |
c | 1.67611 | 0.22991 | 7.29027 | 9.53324× -10 10 |
d | 2.20345 | 0.034133 | 64.5548 | 1.02504× -55 10 |
Estimate | Standard Error | Confidence Interval | |
a | 11.8665 | 6.7705 | {-1.68614,25.4191} |
b | -0.137433 | 0.0132489 | {-0.163954,-0.110912} |
c | 1.67611 | 0.22991 | {1.21589,2.13632} |
d | 2.20345 | 0.034133 | {2.13512,2.27177} |
a+c,
,
,0.998712,0.00449655
b
(+)
2
d
2
eta
e
L
Estimate | Standard Error | t-Statistic | P-Value | |
a | -0.172078 | 0.0274823 | -6.26141 | 5.34761× -8 10 |
b | 1.34271 | 0.133985 | 10.0213 | 3.47755× -14 10 |
c | 7.4407 | 2.48087 | 2.99923 | 0.00400766 |
d | -0.12534 | 0.0088096 | -14.2276 | 2.07504× -20 10 |
e | 1.9662 | 0.0415788 | 47.2884 | 1.98262× -47 10 |
Estimate | Standard Error | Confidence Interval | |
a | -0.172078 | 0.0274823 | {-0.22711,-0.117046} |
b | 1.34271 | 0.133985 | {1.07441,1.61101} |
c | 7.4407 | 2.48087 | {2.47284,12.4086} |
d | -0.12534 | 0.0088096 | {-0.142981,-0.107699} |
e | 1.9662 | 0.0415788 | {1.88294,2.04946} |
a+bL+c++,
,
,0.993574,0.0220512
2
d
2
eta
2
L
2Log[L]
Log[10]
Estimate | Standard Error | t-Statistic | P-Value | |
a | -0.138819 | 0.106034 | -1.30919 | 0.195634 |
b | -0.349119 | 0.0406902 | -8.57994 | 6.58422× -12 10 |
c | 0.539707 | 0.0201169 | 26.8285 | 2.18455× -34 10 |
d | 0.0722968 | 0.00450226 | 16.0579 | 5.18817× -23 10 |
Estimate | Standard Error | Confidence Interval | |
a | -0.138819 | 0.106034 | {-0.351069,0.0734317} |
b | -0.349119 | 0.0406902 | {-0.430569,-0.267669} |
c | 0.539707 | 0.0201169 | {0.499438,0.579975} |
d | 0.0722968 | 0.00450226 | {0.0632846,0.0813091} |
a+bL+c+,
,
,0.998225,0.00619839
e
(+)
2
d
2
eta
2
L
2Log[L]
Log[10]
Estimate | Standard Error | t-Statistic | P-Value | |
a | -0.201588 | 0.0566561 | -3.55809 | 0.000760749 |
b | -0.337393 | 0.0217418 | -15.5182 | 3.99466× -22 10 |
c | 10.4686 | 5.75469 | 1.81914 | 0.0741445 |
d | -0.166945 | 0.0177658 | -9.39702 | 3.49252× -13 10 |
e | 1.55293 | 0.239577 | 6.48196 | 2.31003× -8 10 |
Estimate | Standard Error | Confidence Interval | |
a | -0.201588 | 0.0566561 | {-0.31504,-0.0881359} |
b | -0.337393 | 0.0217418 | {-0.38093,-0.293856} |
c | 10.4686 | 5.75469 | {-1.055,21.9921} |
d | -0.166945 | 0.0177658 | {-0.202521,-0.13137} |
e | 1.55293 | 0.239577 | {1.07318,2.03267} |
a+bL+c++,
,
,0.996806,0.0111531
2
d
2
eta
e
L
2Log[L]
Log[10]
Estimate | Standard Error | t-Statistic | P-Value | |
a | 0.121318 | 0.102368 | 1.18512 | 0.240888 |
b | -0.761394 | 0.10711 | -7.10853 | 2.09814× -9 10 |
c | 1.85233 | 0.308106 | 6.01199 | 1.3748× -7 10 |
d | 0.121039 | 0.0106148 | 11.4029 | 2.46058× -16 10 |
e | 1.54798 | 0.0556219 | 27.8305 | 7.29171× -35 10 |
Estimate | Standard Error | Confidence Interval | |
a | 0.121318 | 0.102368 | {-0.0836701,0.326306} |
b | -0.761394 | 0.10711 | {-0.975877,-0.54691} |
c | 1.85233 | 0.308106 | {1.23536,2.4693} |
d | 0.121039 | 0.0106148 | {0.0997837,0.142295} |
e | 1.54798 | 0.0556219 | {1.4366,1.65936} |
 ,
, ,
,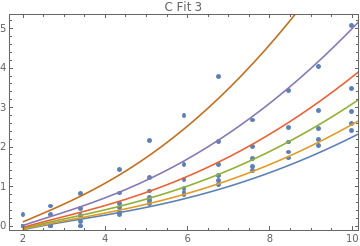 ,
, ,
,
NelderMead
{ParameterTable,ParameterConfidenceIntervalTable,RSquared,EstimatedVariance}
a,
,
,0.884711,0.39562
c
(+)
2
b
2
eta
d
L
Estimate | Standard Error | t-Statistic | P-Value | |
a | 148.274 | 804580. | 0.000184288 | 0.999854 |
b | 139.875 | 1.51469× 7 10 | 9.23454× -6 10 | 0.999993 |
c | -0.816024 | 18434.4 | -0.0000442664 | 0.999965 |
d | 1.84775 | 0.219444 | 8.42014 | 1.2151× -11 10 |
Estimate | Standard Error | Confidence Interval | |
a | 148.274 | 804580. | -1.61039× 6 10 6 10 |
b | 139.875 | 1.51469× 7 10 | -3.03197× 7 10 7 10 |
c | -0.816024 | 18434.4 | {-36901.2,36899.6} |
d | 1.84775 | 0.219444 | {1.40848,2.28701} |
a+c,
,
,0.998712,0.00449655
b
(+)
2
d
2
eta
e
L
Estimate | Standard Error | t-Statistic | P-Value | |
a | -0.172077 | 0.0274822 | -6.26139 | 5.34809× -8 10 |
b | 1.34274 | 0.13399 | 10.0212 | 3.47934× -14 10 |
c | 7.44119 | 2.48111 | 2.99914 | 0.00400864 |
d | -0.125341 | 0.0088098 | -14.2275 | 2.07583× -20 10 |
e | 1.9662 | 0.0415788 | 47.2885 | 1.98257× -47 10 |
Estimate | Standard Error | Confidence Interval | |
a | -0.172077 | 0.0274822 | {-0.227109,-0.117045} |
b | 1.34274 | 0.13399 | {1.07443,1.61105} |
c | 7.44119 | 2.48111 | {2.47286,12.4095} |
d | -0.125341 | 0.0088098 | {-0.142983,-0.1077} |
e | 1.9662 | 0.0415788 | {1.88294,2.04946} |
a+bL+c++,
,
,0.993574,0.0220512
2
d
2
eta
2
L
2Log[L]
Log[10]
Estimate | Standard Error | t-Statistic | P-Value | |
a | -0.138824 | 0.106034 | -1.30924 | 0.195615 |
b | -0.349117 | 0.0406901 | -8.57989 | 6.58548× -12 10 |
c | 0.539706 | 0.0201169 | 26.8284 | 2.18482× -34 10 |
d | 0.0722967 | 0.00450227 | 16.0578 | 5.18924× -23 10 |
Estimate | Standard Error | Confidence Interval | |
a | -0.138824 | 0.106034 | {-0.351075,0.0734259} |
b | -0.349117 | 0.0406901 | {-0.430567,-0.267667} |
c | 0.539706 | 0.0201169 | {0.499437,0.579974} |
d | 0.0722967 | 0.00450227 | {0.0632844,0.0813089} |
a+bL+c+,
,
,0.998225,0.00619839
e
(+)
2
d
2
eta
2
L
2Log[L]
Log[10]
Estimate | Standard Error | t-Statistic | P-Value | |
a | -0.201665 | 0.0566561 | -3.55945 | 0.000757551 |
b | -0.337357 | 0.0217418 | -15.5166 | 4.01415× -22 10 |
c | 10.4454 | 5.73646 | 1.82087 | 0.0738766 |
d | 0.166872 | 0.0177502 | 9.40113 | 3.43941× -13 10 |
e | 1.55195 | 0.239273 | 6.4861 | 2.27382× -8 10 |
Estimate | Standard Error | Confidence Interval | |
a | -0.201665 | 0.0566561 | {-0.315116,-0.0882126} |
b | -0.337357 | 0.0217418 | {-0.380894,-0.29382} |
c | 10.4454 | 5.73646 | {-1.04171,21.9324} |
d | 0.166872 | 0.0177502 | {0.131328,0.202416} |
e | 1.55195 | 0.239273 | {1.07281,2.03109} |
a+bL+c++,
,
,0.996806,0.0111531
2
d
2
eta
e
L
2Log[L]
Log[10]
Estimate | Standard Error | t-Statistic | P-Value | |
a | 0.121332 | 0.102368 | 1.18525 | 0.240837 |
b | -0.761409 | 0.107112 | -7.1085 | 2.09835× -9 10 |
c | 1.85237 | 0.308113 | 6.01197 | 1.37488× -7 10 |
d | 0.121041 | 0.0106149 | 11.4029 | 2.46096× -16 10 |
e | 1.54798 | 0.0556219 | 27.8304 | 7.2929× -35 10 |
Estimate | Standard Error | Confidence Interval | |
a | 0.121332 | 0.102368 | {-0.0836573,0.326321} |
b | -0.761409 | 0.107112 | {-0.975898,-0.54692} |
c | 1.85237 | 0.308113 | {1.23538,2.46935} |
d | 0.121041 | 0.0106149 | {0.0997849,0.142297} |
e | 1.54798 | 0.0556219 | {1.4366,1.65936} |
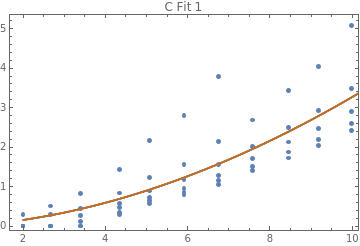 ,
,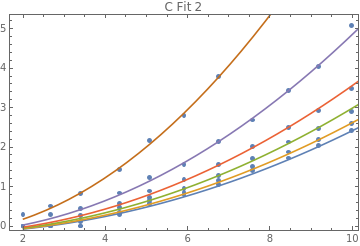 ,
, ,
, ,
,
DifferentialEvolution
{ParameterTable,ParameterConfidenceIntervalTable,RSquared,EstimatedVariance}
a,
,
,0.997715,0.00784102
c
(+)
2
b
2
eta
d
L
Estimate | Standard Error | t-Statistic | P-Value | |
a | 11.8674 | 6.7712 | 1.75263 | 0.0849508 |
b | 0.137435 | 0.0132492 | 10.3731 | 7.8485× -15 10 |
c | 1.67614 | 0.229918 | 7.29017 | 9.53708× -10 10 |
d | 2.20345 | 0.034133 | 64.5548 | 1.02503× -55 10 |
Estimate | Standard Error | Confidence Interval | |
a | 11.8674 | 6.7712 | {-1.68664,25.4214} |
b | 0.137435 | 0.0132492 | {0.110914,0.163956} |
c | 1.67614 | 0.229918 | {1.21591,2.13637} |
d | 2.20345 | 0.034133 | {2.13513,2.27178} |
a+c,
,
,0.998712,0.00449655
b
(+)
2
d
2
eta
e
L
Estimate | Standard Error | t-Statistic | P-Value | |
a | -0.172071 | 0.0274821 | -6.26121 | 5.35164× -8 10 |
b | 1.34275 | 0.13399 | 10.0212 | 3.47917× -14 10 |
c | 7.44123 | 2.48113 | 2.99913 | 0.00400876 |
d | 0.125341 | 0.00880979 | 14.2275 | 2.07569× -20 10 |
e | 1.96621 | 0.0415789 | 47.2886 | 1.9823× -47 10 |
Estimate | Standard Error | Confidence Interval | |
a | -0.172071 | 0.0274821 | {-0.227103,-0.117039} |
b | 1.34275 | 0.13399 | {1.07443,1.61106} |
c | 7.44123 | 2.48113 | {2.47285,12.4096} |
d | 0.125341 | 0.00880979 | {0.1077,0.142983} |
e | 1.96621 | 0.0415789 | {1.88295,2.04947} |
a+bL+c++,
,
,0.993574,0.0220512
2
d
2
eta
2
L
2Log[L]
Log[10]
Estimate | Standard Error | t-Statistic | P-Value | |
a | -0.138818 | 0.106034 | -1.30918 | 0.195636 |
b | -0.34912 | 0.0406902 | -8.57995 | 6.58399× -12 10 |
c | 0.539707 | 0.0201169 | 26.8285 | 2.1845× -34 10 |
d | -0.0722969 | 0.00450226 | -16.0579 | 5.18788× -23 10 |
Estimate | Standard Error | Confidence Interval | |
a | -0.138818 | 0.106034 | {-0.351068,0.0734324} |
b | -0.34912 | 0.0406902 | {-0.43057,-0.267669} |
c | 0.539707 | 0.0201169 | {0.499438,0.579975} |
d | -0.0722969 | 0.00450226 | {-0.0813092,-0.0632847} |
a+bL+c+,
,
,0.998225,0.00619839
e
(+)
2
d
2
eta
2
L
2Log[L]
Log[10]
Estimate | Standard Error | t-Statistic | P-Value | |
a | -0.201605 | 0.0566561 | -3.5584 | 0.00076003 |
b | -0.337386 | 0.0217418 | -15.5179 | 3.99836× -22 10 |
c | 10.4702 | 5.7559 | 1.81904 | 0.0741595 |
d | 0.166949 | 0.0177665 | 9.39683 | 3.49497× -13 10 |
e | 1.55299 | 0.239593 | 6.48178 | 2.31155× -8 10 |
Estimate | Standard Error | Confidence Interval | |
a | -0.201605 | 0.0566561 | {-0.315057,-0.0881531} |
b | -0.337386 | 0.0217418 | {-0.380923,-0.293849} |
c | 10.4702 | 5.7559 | {-1.05578,21.9962} |
d | 0.166949 | 0.0177665 | {0.131372,0.202526} |
e | 1.55299 | 0.239593 | {1.07321,2.03277} |
a+bL+c++,
,
,0.996806,0.0111531
2
d
2
eta
e
L
2Log[L]
Log[10]
Estimate | Standard Error | t-Statistic | P-Value | |
a | 0.121329 | 0.102368 | 1.18522 | 0.240849 |
b | -0.761403 | 0.107111 | -7.10852 | 2.09822× -9 10 |
c | 1.85234 | 0.308109 | 6.01197 | 1.37488× -7 10 |
d | -0.12104 | 0.0106149 | -11.4029 | 2.46075× -16 10 |
e | 1.54798 | 0.055622 | 27.8304 | 7.29273× -35 10 |
Estimate | Standard Error | Confidence Interval | |
a | 0.121329 | 0.102368 | {-0.08366,0.326318} |
b | -0.761403 | 0.107111 | {-0.97589,-0.546916} |
c | 1.85234 | 0.308109 | {1.23537,2.46932} |
d | -0.12104 | 0.0106149 | {-0.142296,-0.0997844} |
e | 1.54798 | 0.055622 | {1.4366,1.65936} |
 ,
, ,
, ,
, ,
,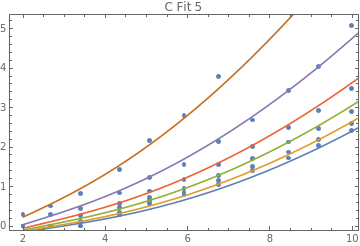
QAC
QAC
In[]:=
For[i=1,i≤Length[method],i++,Print[method[[i]]];Print[resultsQACuncJ[i][[1]][[1]]];Print[resultsQACuncJ[i][[1]][[2;;3]]];Print[resultsQACuncJ[i][[1]][[4;;5]]];Print[resultsQACuncJ[i][[1]][[6;;7]]];Print[resultsQACuncJ[i][[1]][[8;;9]]];Print[resultsQACuncJ[i][[1]][[10;;11]]];Print[Table[Show[ListPlot[JdataQAC],Plot[{gQACuncJ[i,j,L,0.0][[2]],gQACuncJ[i,j,L,0.03][[2]],gQACuncJ[i,j,L,0.05][[2]],gQACuncJ[i,j,L,0.07][[2]],gQACuncJ[i,j,L,0.10][[2]],gQACuncJ[i,j,L,0.15][[2]]},{L,Leffs[[1]],Leffs[[15]]}],FrameTrue,PlotLabel"QAC Fit "<>ToString[j]],{j,1,5}]];]
SimulatedAnnealing
{ParameterTable,ParameterConfidenceIntervalTable,RSquared,EstimatedVariance}
a,
,
,0.995357,0.0254263
c
(+)
2
b
2
eta
d
L
Estimate | Standard Error | t-Statistic | P-Value | |
a | 1.50052 | 0.361306 | 4.15306 | 0.0000823286 |
b | -0.0821242 | 0.00943916 | -8.70038 | 3.74379× -13 10 |
c | 0.626949 | 0.0763364 | 8.21298 | 3.35128× -12 10 |
d | 1.45253 | 0.0268725 | 54.0528 | 3.65882× -64 10 |
Estimate | Standard Error | Confidence Interval | |
a | 1.50052 | 0.361306 | {0.781362,2.21968} |
b | -0.0821242 | 0.00943916 | {-0.100912,-0.0633361} |
c | 0.626949 | 0.0763364 | {0.475006,0.778893} |
d | 1.45253 | 0.0268725 | {1.39904,1.50602} |
a+c,
,
,0.995807,0.0232598
b
(+)
2
d
2
eta
e
L
Estimate | Standard Error | t-Statistic | P-Value | |
a | -0.207728 | 0.0760155 | -2.7327 | 0.00776771 |
b | 0.546966 | 0.0684087 | 7.99556 | 9.59849× -12 10 |
c | 1.64565 | 0.34109 | 4.82468 | 6.82076× -6 10 |
d | 0.0795556 | 0.0089282 | 8.9106 | 1.60898× -13 10 |
e | 1.30622 | 0.0541407 | 24.1264 | 6.43266× -38 10 |
Estimate | Standard Error | Confidence Interval | |
a | -0.207728 | 0.0760155 | {-0.359063,-0.0563924} |
b | 0.546966 | 0.0684087 | {0.410775,0.683157} |
c | 1.64565 | 0.34109 | {0.966593,2.32471} |
d | 0.0795556 | 0.0089282 | {0.0617809,0.0973303} |
e | 1.30622 | 0.0541407 | {1.19844,1.41401} |
a+bL+c++,
,
,0.994274,0.0313624
2
d
2
eta
2
L
2Log[L]
Log[10]
Estimate | Standard Error | t-Statistic | P-Value | |
a | -0.484907 | 0.0791105 | -6.12949 | 3.25825× -8 10 |
b | -0.0672677 | 0.021996 | -3.05818 | 0.00303922 |
c | 0.223953 | 0.0103771 | 21.5813 | 7.26486× -35 10 |
d | -0.0436552 | 0.00435312 | -10.0285 | 9.71633× -16 10 |
Estimate | Standard Error | Confidence Interval | |
a | -0.484907 | 0.0791105 | {-0.642373,-0.327441} |
b | -0.0672677 | 0.021996 | {-0.11105,-0.0234858} |
c | 0.223953 | 0.0103771 | {0.203297,0.244608} |
d | -0.0436552 | 0.00435312 | {-0.0523198,-0.0349905} |
a+bL+c+,
,
,0.99765,0.0130365
e
(+)
2
d
2
eta
2
L
2Log[L]
Log[10]
Estimate | Standard Error | t-Statistic | P-Value | |
a | -0.632467 | 0.0529081 | -11.9541 | 2.5957× -19 10 |
b | -0.0285577 | 0.0146627 | -1.94764 | 0.0550564 |
c | 1.17041 | 0.289942 | 4.0367 | 0.000125713 |
d | -0.0794968 | 0.00733984 | -10.8309 | 3.27564× -17 10 |
e | 0.968952 | 0.0758479 | 12.7749 | 8.23797× -21 10 |
Estimate | Standard Error | Confidence Interval | |
a | -0.632467 | 0.0529081 | {-0.737798,-0.527135} |
b | -0.0285577 | 0.0146627 | {-0.057749,0.000633536} |
c | 1.17041 | 0.289942 | {0.593179,1.74764} |
d | -0.0794968 | 0.00733984 | {-0.0941093,-0.0648843} |
e | 0.968952 | 0.0758479 | {0.81795,1.11995} |
a+bL+c++,
,
,0.996957,0.0168814
2
d
2
eta
e
L
2Log[L]
Log[10]
Estimate | Standard Error | t-Statistic | P-Value | |
a | -0.49141 | 0.0685937 | -7.16407 | 3.83267× -10 10 |
b | -0.184502 | 0.0375372 | -4.91518 | 4.80205× -6 10 |
c | 0.833941 | 0.137902 | 6.04735 | 4.78002× -8 10 |
d | 0.0758146 | 0.00759821 | 9.97795 | 1.39078× -15 10 |
e | 1.54342 | 0.053069 | 29.0833 | 1.27809× -43 10 |
Estimate | Standard Error | Confidence Interval | |
a | -0.49141 | 0.0685937 | {-0.62797,-0.35485} |
b | -0.184502 | 0.0375372 | {-0.259233,-0.109771} |
c | 0.833941 | 0.137902 | {0.559399,1.10848} |
d | 0.0758146 | 0.00759821 | {0.0606877,0.0909415} |
e | 1.54342 | 0.053069 | {1.43777,1.64908} |
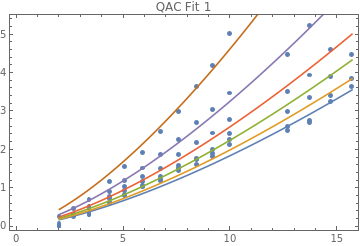 ,
,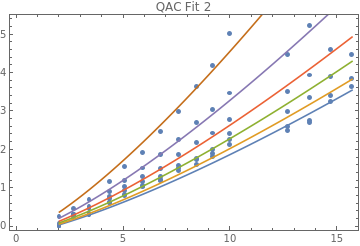 ,
, ,
,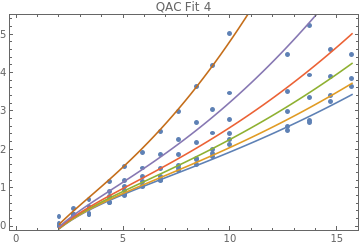 ,
,
RandomSearch
{ParameterTable,ParameterConfidenceIntervalTable,RSquared,EstimatedVariance}
a,
,
,0.995357,0.0254263
c
(+)
2
b
2
eta
d
L
Estimate | Standard Error | t-Statistic | P-Value | |
a | 1.50051 | 0.361301 | 4.15307 | 0.0000823235 |
b | -0.082124 | 0.00943912 | -8.70039 | 3.74361× -13 10 |
c | 0.626948 | 0.076336 | 8.213 | 3.35096× -12 10 |
d | 1.45253 | 0.0268725 | 54.0528 | 3.65875× -64 10 |
Estimate | Standard Error | Confidence Interval | |
a | 1.50051 | 0.361301 | {0.781359,2.21966} |
b | -0.082124 | 0.00943912 | {-0.100912,-0.0633359} |
c | 0.626948 | 0.076336 | {0.475005,0.778891} |
d | 1.45253 | 0.0268725 | {1.39905,1.50602} |
a+c,
,
,0.995807,0.0232598
b
(+)
2
d
2
eta
e
L
Estimate | Standard Error | t-Statistic | P-Value | |
a | -0.207722 | 0.0760152 | -2.73264 | 0.00776901 |
b | 0.546984 | 0.0684125 | 7.99538 | 9.6063× -12 10 |
c | 1.64573 | 0.341123 | 4.82446 | 6.82652× -6 10 |
d | -0.079558 | 0.00892855 | -8.91052 | 1.60956× -13 10 |
e | 1.30623 | 0.0541408 | 24.1264 | 6.43225× -38 10 |
Estimate | Standard Error | Confidence Interval | |
a | -0.207722 | 0.0760152 | {-0.359057,-0.0563876} |
b | 0.546984 | 0.0684125 | {0.410785,0.683183} |
c | 1.64573 | 0.341123 | {0.966611,2.32486} |
d | -0.079558 | 0.00892855 | {-0.0973333,-0.0617826} |
e | 1.30623 | 0.0541408 | {1.19844,1.41401} |
a+bL+c++,
,
,0.994274,0.0313624
2
d
2
eta
2
L
2Log[L]
Log[10]
Estimate | Standard Error | t-Statistic | P-Value | |
a | -0.484909 | 0.0791105 | -6.12952 | 3.2578× -8 10 |
b | -0.067267 | 0.021996 | -3.05815 | 0.00303951 |
c | 0.223952 | 0.0103772 | 21.5813 | 7.26567× -35 10 |
d | 0.043655 | 0.00435312 | 10.0284 | 9.71867× -16 10 |
Estimate | Standard Error | Confidence Interval | |
a | -0.484909 | 0.0791105 | {-0.642375,-0.327444} |
b | -0.067267 | 0.021996 | {-0.111049,-0.0234851} |
c | 0.223952 | 0.0103772 | {0.203297,0.244608} |
d | 0.043655 | 0.00435312 | {0.0349903,0.0523197} |
a+bL+c+,
,
,0.99765,0.0130365
e
(+)
2
d
2
eta
2
L
2Log[L]
Log[10]
Estimate | Standard Error | t-Statistic | P-Value | |
a | -0.632465 | 0.0529081 | -11.954 | 2.59606× -19 10 |
b | -0.0285581 | 0.0146627 | -1.94767 | 0.0550534 |
c | 1.17042 | 0.289946 | 4.03667 | 0.000125724 |
d | -0.0794972 | 0.00733988 | -10.8309 | 3.27573× -17 10 |
e | 0.968955 | 0.0758485 | 12.7749 | 8.24005× -21 10 |
Estimate | Standard Error | Confidence Interval | |
a | -0.632465 | 0.0529081 | {-0.737797,-0.527133} |
b | -0.0285581 | 0.0146627 | {-0.0577494,0.000633166} |
c | 1.17042 | 0.289946 | {0.59318,1.74766} |
d | -0.0794972 | 0.00733988 | {-0.0941097,-0.0648846} |
e | 0.968955 | 0.0758485 | {0.817952,1.11996} |
a+bL+c++,
,
,0.996957,0.0168814
2
d
2
eta
e
L
2Log[L]
Log[10]
Estimate | Standard Error | t-Statistic | P-Value | |
a | -0.49141 | 0.0685937 | -7.16406 | 3.83274× -10 10 |
b | -0.184503 | 0.0375372 | -4.91519 | 4.80198× -6 10 |
c | 0.83394 | 0.137902 | 6.04735 | 4.78002× -8 10 |
d | 0.0758146 | 0.00759821 | 9.97795 | 1.39074× -15 10 |
e | 1.54343 | 0.0530691 | 29.0833 | 1.27808× -43 10 |
Estimate | Standard Error | Confidence Interval | |
a | -0.49141 | 0.0685937 | {-0.627969,-0.35485} |
b | -0.184503 | 0.0375372 | {-0.259233,-0.109772} |
c | 0.83394 | 0.137902 | {0.559399,1.10848} |
d | 0.0758146 | 0.00759821 | {0.0606877,0.0909415} |
e | 1.54343 | 0.0530691 | {1.43777,1.64908} |
 ,
, ,
, ,
, ,
,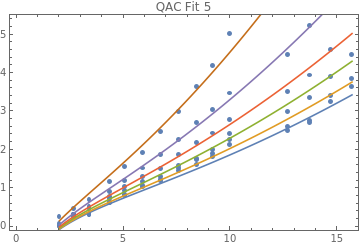
NelderMead
{ParameterTable,ParameterConfidenceIntervalTable,RSquared,EstimatedVariance}
a,
,
,0.995357,0.0254263
c
(+)
2
b
2
eta
d
L
Estimate | Standard Error | t-Statistic | P-Value | |
a | 1.50058 | 0.361329 | 4.15295 | 0.0000823615 |
b | 0.0821256 | 0.00943935 | 8.70034 | 3.74436× -13 10 |
c | 0.626962 | 0.0763389 | 8.21287 | 3.35291× -12 10 |
d | 1.45253 | 0.0268725 | 54.0528 | 3.65877× -64 10 |
Estimate | Standard Error | Confidence Interval | |
a | 1.50058 | 0.361329 | {0.781372,2.21979} |
b | 0.0821256 | 0.00943935 | {0.063337,0.100914} |
c | 0.626962 | 0.0763389 | {0.475013,0.77891} |
d | 1.45253 | 0.0268725 | {1.39905,1.50602} |
a+c,
,
,0.991792,0.0455321
b
(+)
2
d
2
eta
e
L
Estimate | Standard Error | t-Statistic | P-Value | |
a | -0.200138 | 0.107464 | -1.86237 | 0.0663169 |
b | 25.4748 | 215.541 | 0.11819 | 0.906221 |
c | 694.289 | 100582. | 0.00690273 | 0.99451 |
d | -0.842064 | 3.61904 | -0.232676 | 0.816622 |
e | 1.31533 | 0.0778091 | 16.9046 | 8.41532× -28 10 |
Estimate | Standard Error | Confidence Interval | |
a | -0.200138 | 0.107464 | {-0.414082,0.0138069} |
b | 25.4748 | 215.541 | {-403.634,454.584} |
c | 694.289 | 100582. | {-199549.,200937.} |
d | -0.842064 | 3.61904 | {-8.04702,6.36289} |
e | 1.31533 | 0.0778091 | {1.16043,1.47024} |
a+bL+c++,
,
,0.994274,0.0313624
2
d
2
eta
2
L
2Log[L]
Log[10]
Estimate | Standard Error | t-Statistic | P-Value | |
a | -0.484909 | 0.0791105 | -6.12952 | 3.25779× -8 10 |
b | -0.067267 | 0.021996 | -3.05815 | 0.0030395 |
c | 0.223952 | 0.0103772 | 21.5813 | 7.26565× -35 10 |
d | -0.043655 | 0.00435312 | -10.0284 | 9.71843× -16 10 |
Estimate | Standard Error | Confidence Interval | |
a | -0.484909 | 0.0791105 | {-0.642375,-0.327444} |
b | -0.067267 | 0.021996 | {-0.111049,-0.0234851} |
c | 0.223952 | 0.0103772 | {0.203297,0.244608} |
d | -0.043655 | 0.00435312 | {-0.0523197,-0.0349903} |
a+bL+c+,
,
,0.99765,0.0130365
e
(+)
2
d
2
eta
2
L
2Log[L]
Log[10]
Estimate | Standard Error | t-Statistic | P-Value | |
a | -0.632466 | 0.0529081 | -11.954 | 2.59586× -19 10 |
b | -0.0285578 | 0.0146627 | -1.94764 | 0.0550562 |
c | 1.17041 | 0.289943 | 4.03669 | 0.000125716 |
d | -0.0794969 | 0.00733985 | -10.8309 | 3.27573× -17 10 |
e | 0.968952 | 0.075848 | 12.7749 | 8.23854× -21 10 |
Estimate | Standard Error | Confidence Interval | |
a | -0.632466 | 0.0529081 | {-0.737798,-0.527134} |
b | -0.0285578 | 0.0146627 | {-0.057749,0.000633505} |
c | 1.17041 | 0.289943 | {0.593178,1.74764} |
d | -0.0794969 | 0.00733985 | {-0.0941094,-0.0648844} |
e | 0.968952 | 0.075848 | {0.81795,1.11995} |
a+bL+c++,
,
,0.935479,0.357899
2
d
2
eta
e
L
2Log[L]
Log[10]
Estimate | Standard Error | t-Statistic | P-Value | |
a | 436.471 | 6.03531× 6 10 | 0.0000723196 | 0.999942 |
b | 0.214893 | 0.343851 | 0.624959 | 0.533822 |
c | -0.598092 | 8207.32 | -0.0000728731 | 0.999942 |
d | -731.307 | 9.44045× 6 10 | -0.0000774653 | 0.999938 |
e | 0.000596693 | 8.22987 | 0.0000725034 | 0.999942 |
Estimate | Standard Error | Confidence Interval | |
a | 436.471 | 6.03531× 6 10 | -1.20149× 7 10 7 10 |
b | 0.214893 | 0.343851 | {-0.469661,0.899447} |
c | -0.598092 | 8207.32 | {-16340.1,16338.9} |
d | -731.307 | 9.44045× 6 10 | -1.87952× 7 10 7 10 |
e | 0.000596693 | 8.22987 | {-16.3838,16.385} |
 ,
,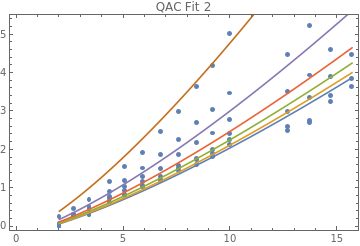 ,
, ,
, ,
,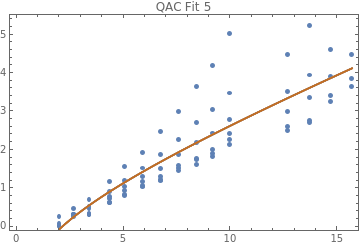
DifferentialEvolution
{ParameterTable,ParameterConfidenceIntervalTable,RSquared,EstimatedVariance}
a,
,
,0.995357,0.0254263
c
(+)
2
b
2
eta
d
L
Estimate | Standard Error | t-Statistic | P-Value | |
a | 1.50054 | 0.361312 | 4.15303 | 0.0000823379 |
b | 0.0821246 | 0.00943921 | 8.70037 | 3.74383× -13 10 |
c | 0.626953 | 0.0763371 | 8.21296 | 3.35164× -12 10 |
d | 1.45253 | 0.0268725 | 54.0528 | 3.65873× -64 10 |
Estimate | Standard Error | Confidence Interval | |
a | 1.50054 | 0.361312 | {0.781364,2.21971} |
b | 0.0821246 | 0.00943921 | {0.0633363,0.100913} |
c | 0.626953 | 0.0763371 | {0.475008,0.778899} |
d | 1.45253 | 0.0268725 | {1.39905,1.50602} |
a+c,
,
,0.995807,0.0232598
b
(+)
2
d
2
eta
e
L
Estimate | Standard Error | t-Statistic | P-Value | |
a | -0.207716 | 0.0760148 | -2.73258 | 0.00777033 |
b | 0.54699 | 0.0684135 | 7.99535 | 9.6075× -12 10 |
c | 1.64575 | 0.341129 | 4.82441 | 6.82801× -6 10 |
d | -0.0795585 | 0.00892861 | -8.91051 | 1.60959× -13 10 |
e | 1.30623 | 0.0541409 | 24.1265 | 6.43115× -38 10 |
Estimate | Standard Error | Confidence Interval | |
a | -0.207716 | 0.0760148 | {-0.35905,-0.0563827} |
b | 0.54699 | 0.0684135 | {0.410789,0.683191} |
c | 1.64575 | 0.341129 | {0.966611,2.32488} |
d | -0.0795585 | 0.00892861 | {-0.097334,-0.061783} |
e | 1.30623 | 0.0541409 | {1.19844,1.41402} |
a+bL+c++,
,
,0.994274,0.0313624
2
d
2
eta
2
L
2Log[L]
Log[10]
Estimate | Standard Error | t-Statistic | P-Value | |
a | -0.484909 | 0.0791105 | -6.12952 | 3.25779× -8 10 |
b | -0.067267 | 0.021996 | -3.05815 | 0.0030395 |
c | 0.223952 | 0.0103772 | 21.5813 | 7.26565× -35 10 |
d | -0.043655 | 0.00435312 | -10.0284 | 9.71849× -16 10 |
Estimate | Standard Error | Confidence Interval | |
a | -0.484909 | 0.0791105 | {-0.642375,-0.327444} |
b | -0.067267 | 0.021996 | {-0.111049,-0.0234851} |
c | 0.223952 | 0.0103772 | {0.203297,0.244608} |
d | -0.043655 | 0.00435312 | {-0.0523197,-0.0349903} |
a+bL+c+,
,
,0.99765,0.0130365
e
(+)
2
d
2
eta
2
L
2Log[L]
Log[10]
Estimate | Standard Error | t-Statistic | P-Value | |
a | -0.63247 | 0.0529081 | -11.9541 | 2.59508× -19 10 |
b | -0.0285567 | 0.0146627 | -1.94757 | 0.0550652 |
c | 1.17042 | 0.289947 | 4.03668 | 0.000125721 |
d | 0.0794969 | 0.00733986 | 10.8308 | 3.27608× -17 10 |
e | 0.968956 | 0.0758483 | 12.7749 | 8.23846× -21 10 |
Estimate | Standard Error | Confidence Interval | |
a | -0.63247 | 0.0529081 | {-0.737801,-0.527138} |
b | -0.0285567 | 0.0146627 | {-0.057748,0.000634591} |
c | 1.17042 | 0.289947 | {0.593182,1.74766} |
d | 0.0794969 | 0.00733986 | {0.0648843,0.0941094} |
e | 0.968956 | 0.0758483 | {0.817953,1.11996} |
a+bL+c++,
,
,0.996957,0.0168814
2
d
2
eta
e
L
2Log[L]
Log[10]
Estimate | Standard Error | t-Statistic | P-Value | |
a | -0.491409 | 0.0685937 | -7.16406 | 3.83283× -10 10 |
b | -0.184502 | 0.0375372 | -4.91519 | 4.802× -6 10 |
c | 0.833937 | 0.137901 | 6.04734 | 4.7801× -8 10 |
d | -0.0758145 | 0.0075982 | -9.97795 | 1.39074× -15 10 |
e | 1.54343 | 0.0530691 | 29.0833 | 1.27811× -43 10 |
Estimate | Standard Error | Confidence Interval | |
a | -0.491409 | 0.0685937 | {-0.627969,-0.35485} |
b | -0.184502 | 0.0375372 | {-0.259233,-0.109771} |
c | 0.833937 | 0.137901 | {0.559396,1.10848} |
d | -0.0758145 | 0.0075982 | {-0.0909414,-0.0606877} |
e | 1.54343 | 0.0530691 | {1.43777,1.64908} |
 ,
, ,
,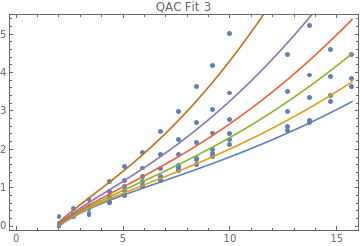 ,
, ,
,
TTS vs. Effective L Fit with Squared Parameters
TTS vs. Effective L Fit with Squared Parameters
C
C
For[i=1,i≤Length[method],i++,Print[method[[i]]];Print[resultsCsqJ[i][[1]][[1]]];Print[resultsCsqJ[i][[1]][[2;;3]]];Print[resultsCsqJ[i][[1]][[4;;5]]];Print[resultsCsqJ[i][[1]][[6;;7]]];Print[resultsCsqJ[i][[1]][[8;;9]]];Print[resultsCsqJ[i][[1]][[10;;11]]];Print[Table[Show[ListPlot[JdataC],Plot[{gCsqJ[i,j,L,0.0][[2]],gCsqJ[i,j,L,0.03][[2]],gCsqJ[i,j,L,0.05][[2]],gCsqJ[i,j,L,0.07][[2]],gCsqJ[i,j,L,0.10][[2]],gCsqJ[i,j,L,0.15][[2]]},{L,Leffs[[1]],Leffs[[15]]}],FrameTrue,PlotLabel"C Fit "<>ToString[j]],{j,1,5}]];]
SimulatedAnnealing
{ParameterTable,ParameterConfidenceIntervalTable,RSquared,EstimatedVariance}
,
,
,0.997715,0.00784102
2
a
2
c
(+)
2
b
2
eta
2
d
L
Estimate | Standard Error | t-Statistic | P-Value | |
a | -3.44291 | 0.981808 | -3.50671 | 0.000882862 |
b | 0.137408 | 0.0132447 | 10.3746 | 7.80484× -15 10 |
c | 1.29448 | 0.0887619 | 14.5837 | 4.64234× -21 10 |
d | -1.48439 | 0.0114971 | -129.11 | 4.7766× -73 10 |
Estimate | Standard Error | Confidence Interval | |
a | -3.44291 | 0.981808 | {-5.40822,-1.47761} |
b | 0.137408 | 0.0132447 | {0.110896,0.16392} |
c | 1.29448 | 0.0887619 | {1.1168,1.47215} |
d | -1.48439 | 0.0114971 | {-1.50741,-1.46138} |
+,
,
,0.997715,0.00797858
2
a
2
c
2
b
(+)
2
d
2
eta
2
e
L
Estimate | Standard Error | t-Statistic | P-Value | |
a | -4.36898× -6 10 | 3668.4 | -1.19098× -9 10 | 1 |
b | -1.29477 | 0.0948801 | -13.6463 | 1.31575× -19 10 |
c | -3.44609 | 1.01489 | -3.39554 | 0.00125332 |
d | 0.137451 | 0.0136803 | 10.0473 | 3.16177× -14 10 |
e | -1.48441 | 0.0202944 | -73.1437 | 4.75886× -58 10 |
Estimate | Standard Error | Confidence Interval | |
a | -4.36898× -6 10 | 3668.4 | {-7345.85,7345.85} |
b | -1.29477 | 0.0948801 | {-1.48476,-1.10477} |
c | -3.44609 | 1.01489 | {-5.47837,-1.41382} |
d | 0.137451 | 0.0136803 | {0.110056,0.164845} |
e | -1.48441 | 0.0202944 | {-1.52505,-1.44377} |
+L+++,
,
,0.851605,0.509227
2
a
2
b
2
c
2
d
2
eta
2
L
2Log[L]
Log[10]
Estimate | Standard Error | t-Statistic | P-Value | |
a | -0.00062725 | 198.378 | -3.16189× -6 10 | 0.999997 |
b | -0.0000861056 | 359.011 | -2.39841× -7 10 | 1. |
c | -0.404817 | 0.0831022 | -4.87131 | 8.93457× -6 10 |
d | -3.80412× -9 10 | 0.0385383 | -9.871× -8 10 | 1. |
Estimate | Standard Error | Confidence Interval | |
a | -0.00062725 | 198.378 | {-397.098,397.097} |
b | -0.0000861056 | 359.011 | {-718.639,718.638} |
c | -0.404817 | 0.0831022 | {-0.571164,-0.23847} |
d | -3.80412× -9 10 | 0.0385383 | {-0.0771429,0.0771429} |
+L++,
,
,0.866482,0.466213
2
a
2
b
2
c
2
e
(+)
2
d
2
eta
2
L
2Log[L]
Log[10]
Estimate | Standard Error | t-Statistic | P-Value | |
a | 7.61235× -9 10 | 2.59181× 7 10 | 2.93708× -16 10 | 1 |
b | -3.71437× -9 10 | 1.94532× 7 10 | -1.90939× -16 10 | 1 |
c | 1.38359 | 1.28888 | 1.07348 | 0.287579 |
d | -4.92489× -9 10 | 868247. | -5.67223× -15 10 | 1 |
e | -1.00602 | 0.233524 | -4.30799 | 0.0000657639 |
Estimate | Standard Error | Confidence Interval | |
a | 7.61235× -9 10 | 2.59181× 7 10 | -5.19001× 7 10 7 10 |
b | -3.71437× -9 10 | 1.94532× 7 10 | -3.89543× 7 10 7 10 |
c | 1.38359 | 1.28888 | {-1.19735,3.96452} |
d | -4.92489× -9 10 | 868247. | -1.73863× 6 10 6 10 |
e | -1.00602 | 0.233524 | {-1.47364,-0.538396} |
+L+++,
,
,0.827932,0.600822
2
a
2
b
2
c
2
d
2
eta
2
e
L
2Log[L]
Log[10]
Estimate | Standard Error | t-Statistic | P-Value | |
a | -0.000123219 | 1662.29 | -7.41265× -8 10 | 1 |
b | -0.0000122442 | 4219.08 | -2.90209× -9 10 | 1 |
c | 0.000138569 | 0.053475 | 0.00259128 | 0.997942 |
d | 3.57914 | 2761.7 | 0.00129599 | 0.99897 |
e | -2.7014 | 1.27575 | -2.1175 | 0.038592 |
Estimate | Standard Error | Confidence Interval | |
a | -0.000123219 | 1662.29 | {-3328.67,3328.67} |
b | -0.0000122442 | 4219.08 | {-8448.57,8448.57} |
c | 0.000138569 | 0.053475 | {-0.106943,0.10722} |
d | 3.57914 | 2761.7 | {-5526.63,5533.79} |
e | -2.7014 | 1.27575 | {-5.25604,-0.146758} |
 ,
,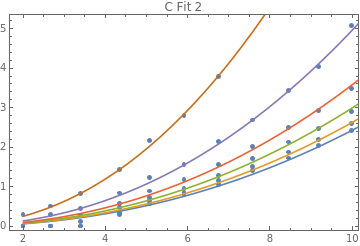 ,
, ,
, ,
,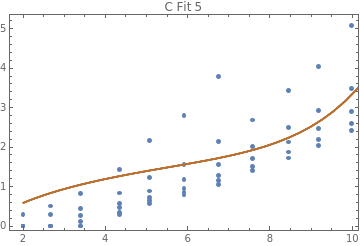
RandomSearch
{ParameterTable,ParameterConfidenceIntervalTable,RSquared,EstimatedVariance}
,
,
,0.997715,0.00784102
2
a
2
c
(+)
2
b
2
eta
2
d
L
Estimate | Standard Error | t-Statistic | P-Value | |
a | 3.44491 | 0.982788 | 3.50525 | 0.000886856 |
b | 0.137435 | 0.0132492 | 10.3731 | 7.84851× -15 10 |
c | -1.29466 | 0.0887949 | -14.5803 | 4.69184× -21 10 |
d | 1.4844 | 0.0114972 | 129.11 | 4.77706× -73 10 |
Estimate | Standard Error | Confidence Interval | |
a | 3.44491 | 0.982788 | {1.47765,5.41218} |
b | 0.137435 | 0.0132492 | {0.110914,0.163956} |
c | -1.29466 | 0.0887949 | {-1.4724,-1.11692} |
d | 1.4844 | 0.0114972 | {1.46139,1.50742} |
+,
,
,0.997715,0.00797858
2
a
2
c
2
b
(+)
2
d
2
eta
2
e
L
Estimate | Standard Error | t-Statistic | P-Value | |
a | 0.0000101183 | 1583.98 | 6.38789× -9 10 | 1 |
b | -1.29469 | 0.0948657 | -13.6476 | 1.31045× -19 10 |
c | -3.44525 | 1.01446 | -3.39615 | 0.00125102 |
d | 0.137439 | 0.0136783 | 10.0479 | 3.1548× -14 10 |
e | 1.4844 | 0.0202944 | 73.1436 | 4.75933× -58 10 |
Estimate | Standard Error | Confidence Interval | |
a | 0.0000101183 | 1583.98 | {-3171.88,3171.88} |
b | -1.29469 | 0.0948657 | {-1.48465,-1.10472} |
c | -3.44525 | 1.01446 | {-5.47667,-1.41383} |
d | 0.137439 | 0.0136783 | {0.110049,0.16483} |
e | 1.4844 | 0.0202944 | {1.44377,1.52504} |
+L+++,
,
,0.851605,0.509226
2
a
2
b
2
c
2
d
2
eta
2
L
2Log[L]
Log[10]
Estimate | Standard Error | t-Statistic | P-Value | |
a | 0.0000133755 | 9303.05 | 1.43775× -9 10 | 1 |
b | -5.83918× -6 10 | 5294.03 | -1.10297× -9 10 | 1 |
c | -0.405024 | 0.0830596 | -4.87631 | 8.77583× -6 10 |
d | -3.40753× -10 10 | 0.0384989 | -8.85097× -9 10 | 1 |
Estimate | Standard Error | Confidence Interval | |
a | 0.0000133755 | 9303.05 | {-18622.1,18622.1} |
b | -5.83918× -6 10 | 5294.03 | {-10597.2,10597.2} |
c | -0.405024 | 0.0830596 | {-0.571286,-0.238762} |
d | -3.40753× -10 10 | 0.0384989 | {-0.0770639,0.0770639} |
+L++,
,
,0.866482,0.466213
2
a
2
b
2
c
2
e
(+)
2
d
2
eta
2
L
2Log[L]
Log[10]
Estimate | Standard Error | t-Statistic | P-Value | |
a | -4.96167× -9 10 | 4.02386× 7 10 | -1.23306× -16 10 | 1 |
b | -1.45272× -8 10 | 5.05201× 6 10 | -2.87553× -15 10 | 1 |
c | -1.38358 | 1.28401 | -1.07755 | 0.285774 |
d | -8.53575× -9 10 | 505859. | -1.68738× -14 10 | 1 |
e | 1.00602 | 0.232469 | 4.32754 | 0.000061524 |
Estimate | Standard Error | Confidence Interval | |
a | -4.96167× -9 10 | 4.02386× 7 10 | -8.05764× 7 10 7 10 |
b | -1.45272× -8 10 | 5.05201× 6 10 | -1.01165× 7 10 7 10 |
c | -1.38358 | 1.28401 | {-3.95477,1.1876} |
d | -8.53575× -9 10 | 505859. | -1.01297× 6 10 6 10 |
e | 1.00602 | 0.232469 | {0.540508,1.47153} |
+L+++,
,
,0.87905,0.42233
2
a
2
b
2
c
2
d
2
eta
2
e
L
2Log[L]
Log[10]
Estimate | Standard Error | t-Statistic | P-Value | |
a | -4.04152× -8 10 | 3.25404× 6 10 | -1.242× -14 10 | 1 |
b | -1.55949× -8 10 | 1.94323× 6 10 | -8.02524× -15 10 | 1 |
c | 0.0259024 | 0.0467769 | 0.553745 | 0.58192 |
d | -0.00102788 | 0.0266643 | -0.0385489 | 0.969385 |
e | 2.14304 | 0.362577 | 5.91058 | 2.0144× -7 10 |
Estimate | Standard Error | Confidence Interval | |
a | -4.04152× -8 10 | 3.25404× 6 10 | -6.51609× 6 10 6 10 |
b | -1.55949× -8 10 | 1.94323× 6 10 | -3.89124× 6 10 6 10 |
c | 0.0259024 | 0.0467769 | {-0.0677667,0.119572} |
d | -0.00102788 | 0.0266643 | {-0.0544223,0.0523665} |
e | 2.14304 | 0.362577 | {1.41699,2.86909} |
 ,
, ,
, ,
, ,
,
NelderMead
{ParameterTable,ParameterConfidenceIntervalTable,RSquared,EstimatedVariance}
,
,
,0.997715,0.00784102
2
a
2
c
(+)
2
b
2
eta
2
d
L
Estimate | Standard Error | t-Statistic | P-Value | |
a | 3.44456 | 0.982607 | 3.50553 | 0.000886089 |
b | 0.13743 | 0.0132483 | 10.3734 | 7.83958× -15 10 |
c | 1.29463 | 0.0887885 | 14.581 | 4.68191× -21 10 |
d | -1.4844 | 0.0114972 | -129.11 | 4.77695× -73 10 |
Estimate | Standard Error | Confidence Interval | |
a | 3.44456 | 0.982607 | {1.47765,5.41146} |
b | 0.13743 | 0.0132483 | {0.11091,0.163949} |
c | 1.29463 | 0.0887885 | {1.1169,1.47235} |
d | -1.4844 | 0.0114972 | {-1.50741,-1.46139} |
+,
,
,0.997715,0.00797858
2
a
2
c
2
b
(+)
2
d
2
eta
2
e
L
Estimate | Standard Error | t-Statistic | P-Value | |
a | 4.32898× -6 10 | 3702.33 | 1.16926× -9 10 | 1 |
b | -1.29465 | 0.0948582 | -13.6482 | 1.30775× -19 10 |
c | 3.44479 | 1.01423 | 3.39647 | 0.00124982 |
d | -0.137433 | 0.0136773 | -10.0483 | 3.15128× -14 10 |
e | 1.4844 | 0.0202944 | 73.1435 | 4.75949× -58 10 |
Estimate | Standard Error | Confidence Interval | |
a | 4.32898× -6 10 | 3702.33 | {-7413.79,7413.79} |
b | -1.29465 | 0.0948582 | {-1.4846,-1.1047} |
c | 3.44479 | 1.01423 | {1.41383,5.47574} |
d | -0.137433 | 0.0136773 | {-0.164822,-0.110045} |
e | 1.4844 | 0.0202944 | {1.44376,1.52504} |
+L+++,
,
,0.851605,0.509226
2
a
2
b
2
c
2
d
2
eta
2
L
2Log[L]
Log[10]
Estimate | Standard Error | t-Statistic | P-Value | |
a | 0.000016747 | 7430.15 | 2.25393× -9 10 | 1 |
b | 0.0000228415 | 1353.36 | 1.68776× -8 10 | 1 |
c | 0.405004 | 0.0830637 | 4.87582 | 8.79121× -6 10 |
d | -6.35021× -10 10 | 0.0385027 | -1.64929× -8 10 | 1 |
Estimate | Standard Error | Confidence Interval | |
a | 0.000016747 | 7430.15 | {-14873.1,14873.1} |
b | 0.0000228415 | 1353.36 | {-2709.05,2709.05} |
c | 0.405004 | 0.0830637 | {0.238734,0.571274} |
d | -6.35021× -10 10 | 0.0385027 | {-0.0770716,0.0770716} |
+L++,
,
,0.842298,0.55066
2
a
2
b
2
c
2
e
(+)
2
d
2
eta
2
L
2Log[L]
Log[10]
Estimate | Standard Error | t-Statistic | P-Value | |
a | 2.44492× -7 10 | 1.07755× 6 10 | 2.26896× -13 10 | 1 |
b | -7.89025× -7 10 | 127872. | -6.17043× -12 10 | 1 |
c | -2.32208 | 17618. | -0.000131802 | 0.999895 |
d | -0.964018 | 80.3952 | -0.011991 | 0.990475 |
e | 9.90148 | 809.017 | 0.0122389 | 0.990278 |
Estimate | Standard Error | Confidence Interval | |
a | 2.44492× -7 10 | 1.07755× 6 10 | -2.15776× 6 10 6 10 |
b | -7.89025× -7 10 | 127872. | {-256059.,256059.} |
c | -2.32208 | 17618. | {-35281.7,35277.} |
d | -0.964018 | 80.3952 | {-161.953,160.025} |
e | 9.90148 | 809.017 | {-1610.13,1629.93} |
+L+++,
,
,0.772388,0.79477
2
a
2
b
2
c
2
d
2
eta
2
e
L
2Log[L]
Log[10]
Estimate | Standard Error | t-Statistic | P-Value | |
a | -2.65308× -9 10 | 9.26451× 7 10 | -2.86371× -17 10 | 1 |
b | 0.162619 | 0.139496 | 1.16576 | 0.248566 |
c | 7.77759× -8 10 | 2.43062× 7 10 | 3.19983× -15 10 | 1 |
d | -0.0649453 | 147.138 | -0.000441391 | 0.999649 |
e | 0.00501846 | 0.112045 | 0.0447895 | 0.964432 |
Estimate | Standard Error | Confidence Interval | |
a | -2.65308× -9 10 | 9.26451× 7 10 | -1.85519× 8 10 8 10 |
b | 0.162619 | 0.139496 | {-0.116717,0.441956} |
c | 7.77759× -8 10 | 2.43062× 7 10 | -4.86724× 7 10 7 10 |
d | -0.0649453 | 147.138 | {-294.703,294.573} |
e | 0.00501846 | 0.112045 | {-0.219349,0.229386} |
 ,
, ,
,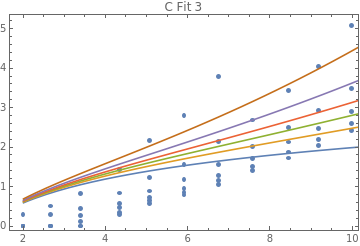 ,
,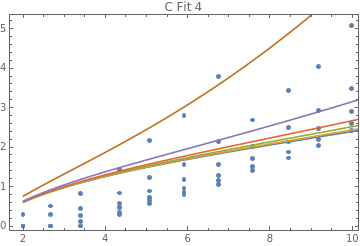 ,
,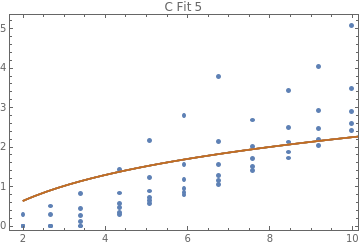
DifferentialEvolution
{ParameterTable,ParameterConfidenceIntervalTable,RSquared,EstimatedVariance}
,
,
,0.997715,0.00784102
2
a
2
c
(+)
2
b
2
eta
2
d
L
Estimate | Standard Error | t-Statistic | P-Value | |
a | -3.44491 | 0.982784 | -3.50525 | 0.000886842 |
b | 0.137435 | 0.0132492 | 10.3731 | 7.8485× -15 10 |
c | 1.29466 | 0.0887948 | 14.5803 | 4.69178× -21 10 |
d | -1.4844 | 0.0114972 | -129.11 | 4.77706× -73 10 |
Estimate | Standard Error | Confidence Interval | |
a | -3.44491 | 0.982784 | {-5.41216,-1.47765} |
b | 0.137435 | 0.0132492 | {0.110914,0.163956} |
c | 1.29466 | 0.0887948 | {1.11692,1.4724} |
d | -1.4844 | 0.0114972 | {-1.50742,-1.46139} |
+,
,
,0.997715,0.00797858
2
a
2
c
2
b
(+)
2
d
2
eta
2
e
L
Estimate | Standard Error | t-Statistic | P-Value | |
a | -4.4574× -9 10 | 3.59566× 6 10 | -1.23966× -15 10 | 1 |
b | 1.29466 | 0.0948599 | 13.6481 | 1.3083× -19 10 |
c | 3.44491 | 1.01428 | 3.3964 | 0.00125008 |
d | -0.137435 | 0.0136776 | -10.0482 | 3.15197× -14 10 |
e | 1.4844 | 0.0202944 | 73.1435 | 4.75953× -58 10 |
Estimate | Standard Error | Confidence Interval | |
a | -4.4574× -9 10 | 3.59566× 6 10 | -7.20019× 6 10 6 10 |
b | 1.29466 | 0.0948599 | {1.1047,1.48461} |
c | 3.44491 | 1.01428 | {1.41384,5.47597} |
d | -0.137435 | 0.0136776 | {-0.164824,-0.110046} |
e | 1.4844 | 0.0202944 | {1.44376,1.52504} |
+L+++,
,
,0.851605,0.509226
2
a
2
b
2
c
2
d
2
eta
2
L
2Log[L]
Log[10]
Estimate | Standard Error | t-Statistic | P-Value | |
a | -2.08986× -8 10 | 5.9541× 6 10 | -3.50996× -15 10 | 1 |
b | 5.27583× -9 10 | 5.85933× 6 10 | 9.00416× -16 10 | 1 |
c | 0.405023 | 0.0830598 | 4.87628 | 8.77681× -6 10 |
d | 3.20478× -16 10 | 0.0384991 | 8.32429× -15 10 | 1 |
Estimate | Standard Error | Confidence Interval | |
a | -2.08986× -8 10 | 5.9541× 6 10 | -1.19184× 7 10 7 10 |
b | 5.27583× -9 10 | 5.85933× 6 10 | -1.17287× 7 10 7 10 |
c | 0.405023 | 0.0830598 | {0.23876,0.571285} |
d | 3.20478× -16 10 | 0.0384991 | {-0.0770644,0.0770644} |
+L++,
,
,0.866482,0.466213
2
a
2
b
2
c
2
e
(+)
2
d
2
eta
2
L
2Log[L]
Log[10]
Estimate | Standard Error | t-Statistic | P-Value | |
a | -1.29606× -8 10 | 1.53088× 7 10 | -8.46613× -16 10 | 1 |
b | 1.70561× -9 10 | 4.26797× 7 10 | 3.9963× -17 10 | 1 |
c | -1.38359 | 1.28661 | -1.07538 | 0.286738 |
d | -6.39753× -9 10 | 671506. | -9.52713× -15 10 | 1 |
e | 1.00602 | 0.233032 | 4.3171 | 0.0000637547 |
Estimate | Standard Error | Confidence Interval | |
a | -1.29606× -8 10 | 1.53088× 7 10 | -3.06554× 7 10 7 10 |
b | 1.70561× -9 10 | 4.26797× 7 10 | -8.54645× 7 10 7 10 |
c | -1.38359 | 1.28661 | {-3.95997,1.1928} |
d | -6.39753× -9 10 | 671506. | -1.34467× 6 10 6 10 |
e | 1.00602 | 0.233032 | {0.539382,1.47266} |
+L+++,
,
,0.87905,0.42233
2
a
2
b
2
c
2
d
2
eta
2
e
L
2Log[L]
Log[10]
Estimate | Standard Error | t-Statistic | P-Value | |
a | -9.93449× -10 10 | 1.3238× 8 10 | -7.50455× -18 10 | 1 |
b | 3.21532× -9 10 | 9.42497× 6 10 | 3.41149× -16 10 | 1 |
c | -0.0259039 | 0.0467788 | -0.553754 | 0.581913 |
d | -0.00102779 | 0.0266643 | -0.0385454 | 0.969388 |
e | -2.14303 | 0.362574 | -5.91061 | 2.01417× -7 10 |
Estimate | Standard Error | Confidence Interval | |
a | -9.93449× -10 10 | 1.3238× 8 10 | -2.65085× 8 10 8 10 |
b | 3.21532× -9 10 | 9.42497× 6 10 | -1.88732× 7 10 7 10 |
c | -0.0259039 | 0.0467788 | {-0.119577,0.067769} |
d | -0.00102779 | 0.0266643 | {-0.0544222,0.0523666} |
e | -2.14303 | 0.362574 | {-2.86907,-1.41699} |
 ,
, ,
, ,
,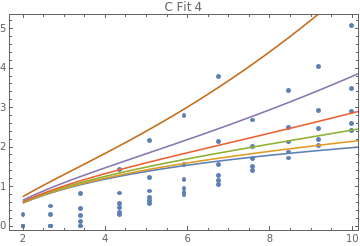 ,
,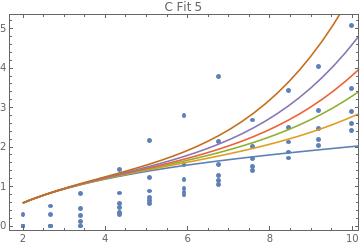
QAC
QAC
For[i=1,i≤Length[method],i++,Print[method[[i]]];Print[resultsQACsqJ[i][[1]][[1]]];Print[resultsQACsqJ[i][[1]][[2;;3]]];Print[resultsQACsqJ[i][[1]][[4;;5]]];Print[resultsQACsqJ[i][[1]][[6;;7]]];Print[resultsQACsqJ[i][[1]][[8;;9]]];Print[resultsQACsqJ[i][[1]][[10;;11]]];Print[Table[Show[ListPlot[JdataQAC],Plot[{gQACsqJ[i,j,L,0.0][[2]],gQACsqJ[i,j,L,0.03][[2]],gQACsqJ[i,j,L,0.05][[2]],gQACsqJ[i,j,L,0.07][[2]],gQACsqJ[i,j,L,0.10][[2]],gQACsqJ[i,j,L,0.15][[2]]},{L,Leffs[[1]],Leffs[[15]]}],FrameTrue,PlotLabel"QAC Fit "<>ToString[j]],{j,1,5}]];]
SimulatedAnnealing
{ParameterTable,ParameterConfidenceIntervalTable,RSquared,EstimatedVariance}
,
,
,0.995357,0.0254263
2
a
2
c
(+)
2
b
2
eta
2
d
L
Estimate | Standard Error | t-Statistic | P-Value | |
a | 1.22493 | 0.147468 | 8.3064 | 2.2024× -12 10 |
b | -0.0821225 | 0.0094389 | -8.70043 | 3.7429× -13 10 |
c | 0.791792 | 0.0482029 | 16.4263 | 3.38367× -27 10 |
d | 1.20521 | 0.0111485 | 108.106 | 1.31785× -87 10 |
Estimate | Standard Error | Confidence Interval | |
a | 1.22493 | 0.147468 | {0.931402,1.51846} |
b | -0.0821225 | 0.0094389 | {-0.10091,-0.0633348} |
c | 0.791792 | 0.0482029 | {0.695847,0.887738} |
d | 1.20521 | 0.0111485 | {1.18302,1.2274} |
+,
,
,0.995357,0.0257523
2
a
2
c
2
b
(+)
2
d
2
eta
2
e
L
Estimate | Standard Error | t-Statistic | P-Value | |
a | -2.01858× -8 10 | 1.70955× 6 10 | -1.18077× -14 10 | 1 |
b | 0.791782 | 0.0519911 | 15.2292 | 4.44828× -25 10 |
c | 1.2249 | 0.149871 | 8.17305 | 4.34752× -12 10 |
d | 0.0821204 | 0.00955415 | 8.59526 | 6.58823× -13 10 |
e | 1.20521 | 0.0250888 | 48.0379 | 1.06333× -59 10 |
Estimate | Standard Error | Confidence Interval | |
a | -2.01858× -8 10 | 1.70955× 6 10 | -3.40344× 6 10 6 10 |
b | 0.791782 | 0.0519911 | {0.688275,0.895288} |
c | 1.2249 | 0.149871 | {0.92653,1.52327} |
d | 0.0821204 | 0.00955415 | {0.0630996,0.101141} |
e | 1.20521 | 0.0250888 | {1.15526,1.25516} |
+L+++,
,
,0.949275,0.277812
2
a
2
b
2
c
2
d
2
eta
2
L
2Log[L]
Log[10]
Estimate | Standard Error | t-Statistic | P-Value | |
a | 3.0919× -9 10 | 2.79954× 7 10 | 1.10443× -16 10 | 1 |
b | -1.32288× -8 10 | 1.64018× 6 10 | -8.06544× -15 10 | 1 |
c | 0.360168 | 0.0400141 | 9.00101 | 9.68382× -14 10 |
d | -0.0142214 | 0.020366 | -0.698289 | 0.487047 |
Estimate | Standard Error | Confidence Interval | |
a | 3.0919× -9 10 | 2.79954× 7 10 | -5.57234× 7 10 7 10 |
b | -1.32288× -8 10 | 1.64018× 6 10 | -3.26469× 6 10 6 10 |
c | 0.360168 | 0.0400141 | {0.280521,0.439814} |
d | -0.0142214 | 0.020366 | {-0.054759,0.0263162} |
+L++,
,
,0.952494,0.263517
2
a
2
b
2
c
2
e
(+)
2
d
2
eta
2
L
2Log[L]
Log[10]
Estimate | Standard Error | t-Statistic | P-Value | |
a | 4.00265× -8 10 | 2.97137× 6 10 | 1.34707× -14 10 | 1 |
b | 3.71757× -8 10 | 886570. | 4.19321× -14 10 | 1 |
c | 0.72959 | 0.309219 | 2.35946 | 0.0208033 |
d | -0.0381293 | 0.0361429 | -1.05496 | 0.2947 |
e | 0.907824 | 0.122481 | 7.41198 | 1.28362× -10 10 |
Estimate | Standard Error | Confidence Interval | |
a | 4.00265× -8 10 | 2.97137× 6 10 | -5.91555× 6 10 6 10 |
b | 3.71757× -8 10 | 886570. | -1.76503× 6 10 6 10 |
c | 0.72959 | 0.309219 | {0.113982,1.3452} |
d | -0.0381293 | 0.0361429 | {-0.110084,0.0338256} |
e | 0.907824 | 0.122481 | {0.663983,1.15166} |
+L+++,
,
,0.956336,0.242203
2
a
2
b
2
c
2
d
2
eta
2
e
L
2Log[L]
Log[10]
Estimate | Standard Error | t-Statistic | P-Value | |
a | -2.50581× -8 10 | 3.51209× 6 10 | -7.13482× -15 10 | 1 |
b | -3.58127× -9 10 | 5.18795× 6 10 | -6.90304× -16 10 | 1 |
c | 0.131609 | 0.0708502 | 1.85756 | 0.0670056 |
d | -0.0141952 | 0.0144196 | -0.984435 | 0.327945 |
e | 1.67967 | 0.118459 | 14.1793 | 2.71406× -23 10 |
Estimate | Standard Error | Confidence Interval | |
a | -2.50581× -8 10 | 3.51209× 6 10 | -6.99204× 6 10 6 10 |
b | -3.58127× -9 10 | 5.18795× 6 10 | -1.03284× 7 10 7 10 |
c | 0.131609 | 0.0708502 | {-0.00944338,0.27266} |
d | -0.0141952 | 0.0144196 | {-0.0429024,0.0145121} |
e | 1.67967 | 0.118459 | {1.44383,1.9155} |
 ,
, ,
, ,
,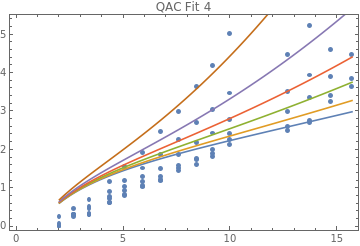 ,
,
RandomSearch
{ParameterTable,ParameterConfidenceIntervalTable,RSquared,EstimatedVariance}
,
,
,0.995357,0.0254263
2
a
2
c
(+)
2
b
2
eta
2
d
L
Estimate | Standard Error | t-Statistic | P-Value | |
a | 1.22497 | 0.14748 | 8.306 | 2.20634× -12 10 |
b | 0.0821249 | 0.00943925 | 8.70036 | 3.74398× -13 10 |
c | -0.791806 | 0.0482048 | -16.4259 | 3.38864× -27 10 |
d | 1.20521 | 0.0111485 | 108.106 | 1.31782× -87 10 |
Estimate | Standard Error | Confidence Interval | |
a | 1.22497 | 0.14748 | {0.931418,1.51852} |
b | 0.0821249 | 0.00943925 | {0.0633366,0.100913} |
c | -0.791806 | 0.0482048 | {-0.887755,-0.695856} |
d | 1.20521 | 0.0111485 | {1.18302,1.2274} |
+,
,
,0.995357,0.0257523
2
a
2
c
2
b
(+)
2
d
2
eta
2
e
L
Estimate | Standard Error | t-Statistic | P-Value | |
a | 3.1615× -6 10 | 10915.2 | 2.89641× -10 10 | 1 |
b | 0.791799 | 0.051994 | 15.2287 | 4.457× -25 10 |
c | -1.22495 | 0.149887 | -8.17252 | 4.35771× -12 10 |
d | -0.0821239 | 0.00955468 | -8.59514 | 6.59171× -13 10 |
e | 1.20521 | 0.0250888 | 48.0379 | 1.06332× -59 10 |
Estimate | Standard Error | Confidence Interval | |
a | 3.1615× -6 10 | 10915.2 | {-21730.5,21730.5} |
b | 0.791799 | 0.051994 | {0.688287,0.895312} |
c | -1.22495 | 0.149887 | {-1.52335,-0.926551} |
d | -0.0821239 | 0.00955468 | {-0.101146,-0.0631019} |
e | 1.20521 | 0.0250888 | {1.15526,1.25516} |
+L+++,
,
,0.949275,0.277812
2
a
2
b
2
c
2
d
2
eta
2
L
2Log[L]
Log[10]
Estimate | Standard Error | t-Statistic | P-Value | |
a | -8.49164× -9 10 | 1.01934× 7 10 | -8.3305× -16 10 | 1 |
b | -7.85814× -9 10 | 2.76115× 6 10 | -2.84596× -15 10 | 1 |
c | 0.360168 | 0.0400141 | 9.00101 | 9.68374× -14 10 |
d | 0.0142214 | 0.020366 | 0.698288 | 0.487047 |
Estimate | Standard Error | Confidence Interval | |
a | -8.49164× -9 10 | 1.01934× 7 10 | -2.02895× 7 10 7 10 |
b | -7.85814× -9 10 | 2.76115× 6 10 | -5.49594× 6 10 6 10 |
c | 0.360168 | 0.0400141 | {0.280521,0.439814} |
d | 0.0142214 | 0.020366 | {-0.0263162,0.0547589} |
+L++,
,
,0.952494,0.263517
2
a
2
b
2
c
2
e
(+)
2
d
2
eta
2
L
2Log[L]
Log[10]
Estimate | Standard Error | t-Statistic | P-Value | |
a | -4.55379× -8 10 | 2.61175× 6 10 | -1.74357× -14 10 | 1 |
b | -1.44731× -8 10 | 2.27725× 6 10 | -6.35552× -15 10 | 1 |
c | 0.72959 | 0.309219 | 2.35946 | 0.0208033 |
d | -0.0381293 | 0.0361429 | -1.05496 | 0.2947 |
e | 0.907824 | 0.122481 | 7.41198 | 1.28363× -10 10 |
Estimate | Standard Error | Confidence Interval | |
a | -4.55379× -8 10 | 2.61175× 6 10 | -5.1996× 6 10 6 10 |
b | -1.44731× -8 10 | 2.27725× 6 10 | -4.53366× 6 10 6 10 |
c | 0.72959 | 0.309219 | {0.113982,1.3452} |
d | -0.0381293 | 0.0361429 | {-0.110084,0.0338256} |
e | 0.907824 | 0.122481 | {0.663983,1.15166} |
+L+++,
,
,0.956336,0.242203
2
a
2
b
2
c
2
d
2
eta
2
e
L
2Log[L]
Log[10]
Estimate | Standard Error | t-Statistic | P-Value | |
a | -4.59586× -9 10 | 1.91491× 7 10 | -2.40004× -16 10 | 1 |
b | -9.78937× -9 10 | 1.89792× 6 10 | -5.15794× -15 10 | 1 |
c | 0.131609 | 0.0708502 | 1.85756 | 0.0670055 |
d | 0.0141951 | 0.0144196 | 0.984435 | 0.327946 |
e | 1.67967 | 0.118459 | 14.1793 | 2.71402× -23 10 |
Estimate | Standard Error | Confidence Interval | |
a | -4.59586× -9 10 | 1.91491× 7 10 | -3.81229× 7 10 7 10 |
b | -9.78937× -9 10 | 1.89792× 6 10 | -3.77847× 6 10 6 10 |
c | 0.131609 | 0.0708502 | {-0.00944333,0.27266} |
d | 0.0141951 | 0.0144196 | {-0.0145121,0.0429023} |
e | 1.67967 | 0.118459 | {1.44383,1.9155} |
 ,
, ,
, ,
, ,
,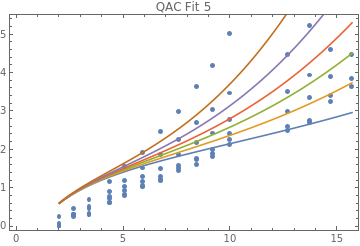
NelderMead
{ParameterTable,ParameterConfidenceIntervalTable,RSquared,EstimatedVariance}
,
,
,0.991573,0.046151
2
a
2
c
(+)
2
b
2
eta
2
d
L
Estimate | Standard Error | t-Statistic | P-Value | |
a | 468.591 | 1552.28 | 0.301872 | 0.763543 |
b | 0.553083 | 1.01397 | 0.545465 | 0.586971 |
c | 3.5566 | 6.28816 | 0.565603 | 0.573267 |
d | 1.2112 | 0.0151463 | 79.9666 | 2.34536× -77 10 |
Estimate | Standard Error | Confidence Interval | |
a | 468.591 | 1552.28 | {-2621.15,3558.33} |
b | 0.553083 | 1.01397 | {-1.46517,2.57133} |
c | 3.5566 | 6.28816 | {-8.95967,16.0729} |
d | 1.2112 | 0.0151463 | {1.18105,1.24135} |
+,
,
,0.995357,0.0257523
2
a
2
c
2
b
(+)
2
d
2
eta
2
e
L
Estimate | Standard Error | t-Statistic | P-Value | |
a | 6.88081× -10 10 | 5.01517× 7 10 | 1.372× -17 10 | 1 |
b | -0.791819 | 0.0519972 | -15.2281 | 4.46632× -25 10 |
c | 1.22501 | 0.149904 | 8.17194 | 4.36895× -12 10 |
d | -0.0821276 | 0.00955526 | -8.59502 | 6.59525× -13 10 |
e | 1.20521 | 0.0250888 | 48.0379 | 1.06325× -59 10 |
Estimate | Standard Error | Confidence Interval | |
a | 6.88081× -10 10 | 5.01517× 7 10 | -9.98443× 7 10 7 10 |
b | -0.791819 | 0.0519972 | {-0.895338,-0.688301} |
c | 1.22501 | 0.149904 | {0.926574,1.52345} |
d | -0.0821276 | 0.00955526 | {-0.101151,-0.0631046} |
e | 1.20521 | 0.0250888 | {1.15526,1.25516} |
+L+++,
,
,0.949275,0.277812
2
a
2
b
2
c
2
d
2
eta
2
L
2Log[L]
Log[10]
Estimate | Standard Error | t-Statistic | P-Value | |
a | -7.21592× -9 10 | 1.19956× 7 10 | -6.0155× -16 10 | 1 |
b | -7.6354× -9 10 | 2.8417× 6 10 | -2.68691× -15 10 | 1 |
c | 0.360168 | 0.0400141 | 9.00101 | 9.68368× -14 10 |
d | 0.0142214 | 0.020366 | 0.698288 | 0.487047 |
Estimate | Standard Error | Confidence Interval | |
a | -7.21592× -9 10 | 1.19956× 7 10 | -2.38766× 7 10 7 10 |
b | -7.6354× -9 10 | 2.8417× 6 10 | -5.65626× 6 10 6 10 |
c | 0.360168 | 0.0400141 | {0.280521,0.439814} |
d | 0.0142214 | 0.020366 | {-0.0263162,0.0547589} |
+L++,
,
,0.952494,0.263517
2
a
2
b
2
c
2
e
(+)
2
d
2
eta
2
L
2Log[L]
Log[10]
Estimate | Standard Error | t-Statistic | P-Value | |
a | -7.19536× -9 10 | 1.65292× 7 10 | -4.35312× -16 10 | 1 |
b | -7.21154× -9 10 | 4.5703× 6 10 | -1.57791× -15 10 | 1 |
c | 0.729585 | 0.309215 | 2.35948 | 0.0208024 |
d | 0.038129 | 0.0361427 | 1.05495 | 0.294703 |
e | 0.907822 | 0.12248 | 7.412 | 1.28348× -10 10 |
Estimate | Standard Error | Confidence Interval | |
a | -7.19536× -9 10 | 1.65292× 7 10 | -3.29071× 7 10 7 10 |
b | -7.21154× -9 10 | 4.5703× 6 10 | -9.09877× 6 10 6 10 |
c | 0.729585 | 0.309215 | {0.113986,1.34518} |
d | 0.038129 | 0.0361427 | {-0.0338257,0.110084} |
e | 0.907822 | 0.12248 | {0.663983,1.15166} |
+L+++,
,
,0.956336,0.242203
2
a
2
b
2
c
2
d
2
eta
2
e
L
2Log[L]
Log[10]
Estimate | Standard Error | t-Statistic | P-Value | |
a | -2.1005× -9 10 | 4.1898× 7 10 | -5.01336× -17 10 | 1 |
b | -8.8437× -9 10 | 2.10087× 6 10 | -4.20954× -15 10 | 1 |
c | 0.131609 | 0.0708502 | 1.85756 | 0.0670055 |
d | 0.0141951 | 0.0144196 | 0.984434 | 0.327946 |
e | 1.67967 | 0.118459 | 14.1793 | 2.71403× -23 10 |
Estimate | Standard Error | Confidence Interval | |
a | -2.1005× -9 10 | 4.1898× 7 10 | -8.34125× 7 10 7 10 |
b | -8.8437× -9 10 | 2.10087× 6 10 | -4.18251× 6 10 6 10 |
c | 0.131609 | 0.0708502 | {-0.00944334,0.27266} |
d | 0.0141951 | 0.0144196 | {-0.0145121,0.0429023} |
e | 1.67967 | 0.118459 | {1.44383,1.9155} |
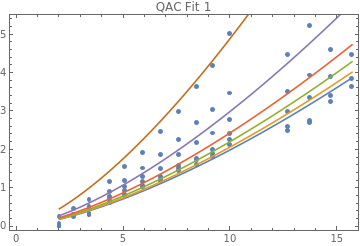 ,
, ,
, ,
, ,
,
DifferentialEvolution
{ParameterTable,ParameterConfidenceIntervalTable,RSquared,EstimatedVariance}
,
,
,0.995357,0.0254263
2
a
2
c
(+)
2
b
2
eta
2
d
L
Estimate | Standard Error | t-Statistic | P-Value | |
a | 1.22496 | 0.147479 | 8.30605 | 2.20581× -12 10 |
b | 0.0821246 | 0.00943921 | 8.70037 | 3.74383× -13 10 |
c | 0.791804 | 0.0482046 | 16.4259 | 3.38798× -27 10 |
d | 1.20521 | 0.0111485 | 108.106 | 1.31781× -87 10 |
Estimate | Standard Error | Confidence Interval | |
a | 1.22496 | 0.147479 | {0.931415,1.51851} |
b | 0.0821246 | 0.00943921 | {0.0633363,0.100913} |
c | 0.791804 | 0.0482046 | {0.695855,0.887753} |
d | 1.20521 | 0.0111485 | {1.18302,1.2274} |
+,
,
,0.995357,0.0257523
2
a
2
c
2
b
(+)
2
d
2
eta
2
e
L
Estimate | Standard Error | t-Statistic | P-Value | |
a | -3.54596× -9 10 | 9.73177× 6 10 | -3.6437× -16 10 | 1 |
b | 0.791804 | 0.0519946 | 15.2286 | 4.45858× -25 10 |
c | 1.22496 | 0.14989 | 8.17241 | 4.35997× -12 10 |
d | 0.0821246 | 0.00955479 | 8.59513 | 6.59211× -13 10 |
e | 1.20521 | 0.0250888 | 48.0379 | 1.06322× -59 10 |
Estimate | Standard Error | Confidence Interval | |
a | -3.54596× -9 10 | 9.73177× 6 10 | -1.93745× 7 10 7 10 |
b | 0.791804 | 0.0519946 | {0.68829,0.895317} |
c | 1.22496 | 0.14989 | {0.926555,1.52337} |
d | 0.0821246 | 0.00955479 | {0.0631025,0.101147} |
e | 1.20521 | 0.0250888 | {1.15526,1.25516} |
+L+++,
,
,0.949275,0.277812
2
a
2
b
2
c
2
d
2
eta
2
L
2Log[L]
Log[10]
Estimate | Standard Error | t-Statistic | P-Value | |
a | 9.42359× -9 10 | 9.18535× 6 10 | 1.02594× -15 10 | 1 |
b | -9.30922× -10 10 | 2.33076× 7 10 | -3.99407× -17 10 | 1 |
c | 0.360168 | 0.0400141 | 9.00101 | 9.68377× -14 10 |
d | 0.0142214 | 0.020366 | 0.698288 | 0.487047 |
Estimate | Standard Error | Confidence Interval | |
a | 9.42359× -9 10 | 9.18535× 6 10 | -1.8283× 7 10 7 10 |
b | -9.30922× -10 10 | 2.33076× 7 10 | -4.63926× 7 10 7 10 |
c | 0.360168 | 0.0400141 | {0.280521,0.439814} |
d | 0.0142214 | 0.020366 | {-0.0263162,0.0547589} |
+L++,
,
,0.952494,0.263517
2
a
2
b
2
c
2
e
(+)
2
d
2
eta
2
L
2Log[L]
Log[10]
Estimate | Standard Error | t-Statistic | P-Value | |
a | -6.62624× -9 10 | 1.79489× 7 10 | -3.69172× -16 10 | 1 |
b | -4.55462× -9 10 | 7.23636× 6 10 | -6.29408× -16 10 | 1 |
c | 0.729591 | 0.30922 | 2.35946 | 0.0208034 |
d | -0.0381293 | 0.0361429 | -1.05496 | 0.2947 |
e | -0.907824 | 0.122481 | -7.41198 | 1.28364× -10 10 |
Estimate | Standard Error | Confidence Interval | |
a | -6.62624× -9 10 | 1.79489× 7 10 | -3.57335× 7 10 7 10 |
b | -4.55462× -9 10 | 7.23636× 6 10 | -1.44065× 7 10 7 10 |
c | 0.729591 | 0.30922 | {0.113982,1.3452} |
d | -0.0381293 | 0.0361429 | {-0.110084,0.0338256} |
e | -0.907824 | 0.122481 | {-1.15166,-0.663984} |
+L+++,
,
,0.956336,0.242203
2
a
2
b
2
c
2
d
2
eta
2
e
L
2Log[L]
Log[10]
Estimate | Standard Error | t-Statistic | P-Value | |
a | 1.85362× -8 10 | 4.74783× 6 10 | 3.90413× -15 10 | 1 |
b | -6.95726× -10 10 | 2.67051× 7 10 | -2.60522× -17 10 | 1 |
c | -0.131609 | 0.0708502 | -1.85756 | 0.0670055 |
d | -0.0141951 | 0.0144196 | -0.984435 | 0.327946 |
e | 1.67967 | 0.118459 | 14.1793 | 2.71402× -23 10 |
Estimate | Standard Error | Confidence Interval | |
a | 1.85362× -8 10 | 4.74783× 6 10 | -9.4522× 6 10 6 10 |
b | -6.95726× -10 10 | 2.67051× 7 10 | -5.31658× 7 10 7 10 |
c | -0.131609 | 0.0708502 | {-0.272661,0.00944332} |
d | -0.0141951 | 0.0144196 | {-0.0429023,0.0145121} |
e | 1.67967 | 0.118459 | {1.44383,1.9155} |
 ,
, ,
,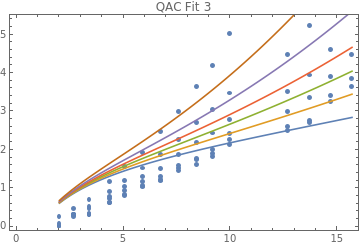 ,
, ,
,
Summary
Summary
A summary of the problems with each test function is provided below. There was some variation across different optimization algorithms used, but the following represents the best results found. As can be seen, test function 1 with squared parameters is the only one that works for both C and QAC in terms of producing a physical model with reasonable statistics.
Print[Text["Versus L"]];TextGrid[{{"Test Function","Unconstrained C","Unconstrained QAC","Squared C","Squared QAC"},{testfunc[1,L,η],"large p-value for a",✓,✓,✓},{testfunc[2,L,η],"a < 0","large p-value for a","large p-value for a",✓},{testfunc[3,L,η],"a, b < 0","a, b < 0","large p-values for a, b, d","large p-values for a, b, d"},{testfunc[4,L,η],"a, b < 0 & large p-value for c","a, b < 0","large p-values for a, b, d","large p-values for a, b, d"},{testfunc[5,L,η],"b < 0 & large p-value for a","a, b < 0","large p-values for a, b, d","large p-values for a, b, c, d"}},ItemStyle{Automatic,{1{Bold,14}}},Frame{All,1True},Background{None,{{LightOrange,LightGray}}}]
Versus L
Test Function | Unconstrained C | Unconstrained QAC | Squared C | Squared QAC |
a d L c 2 b 2 η | large p-value for a | ✓ | ✓ | ✓ |
a+c e L b 2 d 2 η | a < 0 | large p-value for a | large p-value for a | ✓ |
a+bL+c 2 L 2 d 2 η 2Log[L] Log[10] | a, b < 0 | a, b < 0 | large p-values for a, b, d | large p-values for a, b, d |
a+bL+c 2 L e 2 d 2 η 2Log[L] Log[10] | a, b < 0 & large p-value for c | a, b < 0 | large p-values for a, b, d | large p-values for a, b, d |
a+bL+c e L 2 d 2 η 2Log[L] Log[10] | b < 0 & large p-value for a | a, b < 0 | large p-values for a, b, d | large p-values for a, b, c, d |
Print[Text["Versus Effective L"]];TextGrid[{{"Test Function","Unconstrained C","Unconstrained QAC","Squared C","Squared QAC"},{testfunc[1,L,η],"large p-value for a",✓,✓,✓},{testfunc[2,L,η],"a < 0","a < 0","large p-value for a","large p-value for a"},{testfunc[3,L,η],"a, b < 0 & large p-value for a","a, b < 0","large p-values for a, d","large p-values for a, b, d"},{testfunc[4,L,η],"a, b < 0","a, b < 0","large p-values for a, b, d","large p-values for a, b, d"},{testfunc[5,L,η],"b < 0 & large p-value for a","a, b < 0","large p-values for a, b, d","large p-values for a, b, d"}},ItemStyle{Automatic,{1{Bold,14}}},Frame{All,1True},Background{None,{{LightOrange,LightGray}}}]
Versus Effective L
Test Function | Unconstrained C | Unconstrained QAC | Squared C | Squared QAC |
a d L c 2 b 2 η | large p-value for a | ✓ | ✓ | ✓ |
a+c e L b 2 d 2 η | a < 0 | a < 0 | large p-value for a | large p-value for a |
a+bL+c 2 L 2 d 2 η 2Log[L] Log[10] | a, b < 0 & large p-value for a | a, b < 0 | large p-values for a, d | large p-values for a, b, d |
a+bL+c 2 L e 2 d 2 η 2Log[L] Log[10] | a, b < 0 | a, b < 0 | large p-values for a, b, d | large p-values for a, b, d |
a+bL+c e L 2 d 2 η 2Log[L] Log[10] | b < 0 & large p-value for a | a, b < 0 | large p-values for a, b, d | large p-values for a, b, d |
Error Bar Fitting
Error Bar Fitting
Here, we fit the TTS error bars representing the 95% C.I. after bootstrapping to test function 1 with the parameters found. NOTE: The confidence bands shown below are a generalization of confidence intervals to a function, effectively offering a confidence interval point by point. In the text, we used a more straightforward method of using the original test function with set to the upper and lower bounds, respectively, determined by the fitting procedure below. As such, both are based on the same results, but the visualization given below is slightly more complex.
d
+/-
(*Formattingerrorbardatatobefit*)Table[LogdatCerrs[j]=Table[{L,Log10[datC[j][[L-1,2]]],Log10[datC[j][[L-1,2]]-datC[j][[L-1,4]]],Log10[datC[j][[L-1,2]]+datC[j][[L-1,3]]]},{L,2,Length[datC[j]]+1}],{j,6}];Table[LogdatQACerrs[j]=Table[{L,Log10[datQAC[j][[L-1,2]]],Log10[datQAC[j][[L-1,2]]-datQAC[j][[L-1,4]]],Log10[datQAC[j][[L-1,2]]+datQAC[j][[L-1,3]]]},{L,2,Length[datQAC[j]]+1}],{j,6}];dataCmax=Flatten[Table[{η[j],L,LogdatCerrs[j][[L-1,4]]},{j,1,6},{L,2,Length[LogdatCerrs[j]]+1}],1];dataCmin=Flatten[Table[{η[j],L,LogdatCerrs[j][[L-1,3]]},{j,1,6},{L,2,Length[LogdatCerrs[j]]+1}],1];dataQACmax=Flatten[Table[{η[j],L,LogdatQACerrs[j][[L-1,4]]},{j,1,6},{L,2,Length[LogdatQACerrs[j]]+1}],1];dataQACmin=Flatten[Table[{η[j],L,LogdatQACerrs[j][[L-1,3]]},{j,1,6},{L,2,Length[LogdatQACerrs[j]]+1}],1];
(*Applyingthefit*)fitCmax=NonlinearModelFit[dataCmax,{testfsq[1,L,eta]/.{a2.8309768898508016,b0.1338588654106869,c1.2676354190352963}},{{d,1.4569116149924455}},{eta,L},Method{NMinimize,MethodDifferentialEvolution}];fitCmin=NonlinearModelFit[dataCmin,{testfsq[1,L,eta]/.{a2.8309768898508016,b0.1338588654106869,c1.2676354190352963}},{{d,1.4569116149924455}},{eta,L},Method{NMinimize,MethodDifferentialEvolution}];fitQACmax=NonlinearModelFit[dataQACmax,{testfsq[1,L,eta]/.{a0.6258944225492833,b0.06912167013280762,c0.6973834244561097}},{{d,1.3152790467460662}},{eta,L},Method{NMinimize,MethodDifferentialEvolution}];fitQACmin=NonlinearModelFit[dataQACmin,{testfsq[1,L,eta]/.{a0.6258944225492833,b0.06912167013280762,c0.6973834244561097}},{{d,1.3152790467460662}},{eta,L},Method{NMinimize,MethodDifferentialEvolution}];
(*Fitresults*)Grid[{#,fitCmin[#],fitCmax[#]}&[{"ParameterTable","ParameterConfidenceIntervalTable","RSquared","EstimatedVariance"}],AlignmentLeft]
ParameterTable | ParameterConfidenceIntervalTable | RSquared | EstimatedVariance | ||||||||||||||||||
|
| 0.996902 | 0.00893234 | ||||||||||||||||||
|
| 0.997098 | 0.0106539 |
Grid[{#,fitQACmin[#],fitQACmax[#]}&[{"ParameterTable","ParameterConfidenceIntervalTable","RSquared","EstimatedVariance"}],AlignmentLeft]
ParameterTable | ParameterConfidenceIntervalTable | RSquared | EstimatedVariance | ||||||||||||||||||
|
| 0.997218 | 0.0129568 | ||||||||||||||||||
|
| 0.996616 | 0.0198852 |
(*FitresultsvisualizedasshadedregionaroundmedianTTSwitherrorbarsateachnoiserealization*)Table[LogdatCbars[j]=Table[{L,Around[LogdatCerrs[j][[L-1,2]],{LogdatCerrs[j][[L-1,2]]-LogdatCerrs[j][[L-1,3]],LogdatCerrs[j][[L-1,4]]-LogdatCerrs[j][[L-1,2]]}]},{L,2,Length[LogdatCerrs[j]]+1}],{j,6}];minCBand[L_,eta_]=fitCmin["SinglePredictionBands",ConfidenceLevel0.95];maxCBand[L_,eta_]=fitCmax["SinglePredictionBands",ConfidenceLevel0.95];Table[plC[j]=Show[ListPlot[LogdatCbars[j],PlotRangeAll,PlotLabelη[j],AxesLabel{"L","Log10(TTS)"}],Plot[{fitCsqL[1,1][[2]][η[j],L],minCBand[L,η[j]][[1]],maxCBand[L,η[j]][[2]]},{L,1.9,12.5},Filling{2{1},3{2}}]],{j,6}];GraphicsGrid[Table[plC[j+k],{j,0,3,3},{k,3}],ImageSizeFull]
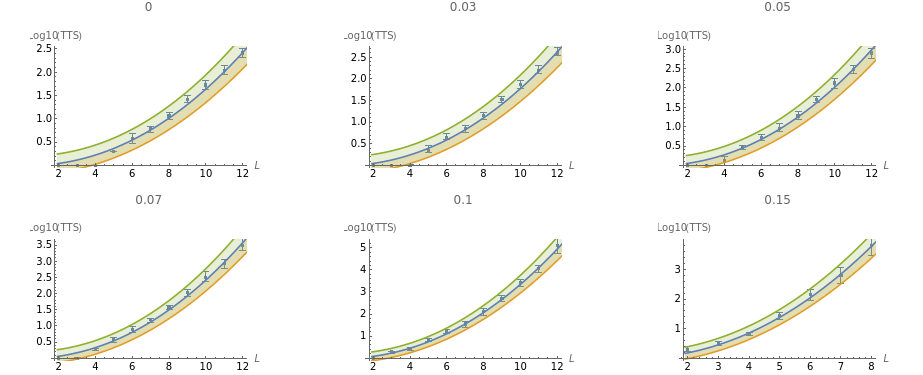
Table[LogdatQACbars[j]=Table[{L,Around[LogdatQACerrs[j][[L-1,2]],{LogdatQACerrs[j][[L-1,2]]-LogdatQACerrs[j][[L-1,3]],LogdatQACerrs[j][[L-1,4]]-LogdatQACerrs[j][[L-1,2]]}]},{L,2,Length[LogdatQACerrs[j]]+1}],{j,6}];minQACBand[L_,eta_]=fitQACmin["SinglePredictionBands",ConfidenceLevel0.95];maxQACBand[L_,eta_]=fitQACmax["SinglePredictionBands",ConfidenceLevel0.95];Table[plQAC[j]=Show[ListPlot[LogdatQACbars[j],PlotRangeAll,PlotLabelη[j],AxesLabel{"L","Log10(TTS)"}],Plot[{fitQACsqL[1,1][[2]][η[j],L],minQACBand[L,η[j]][[1]],maxQACBand[L,η[j]][[2]]},{L,1.7,16.5},Filling{2{1},3{2}}]],{j,6}];GraphicsGrid[Table[plQAC[j+k],{j,0,3,3},{k,3}],ImageSizeFull]
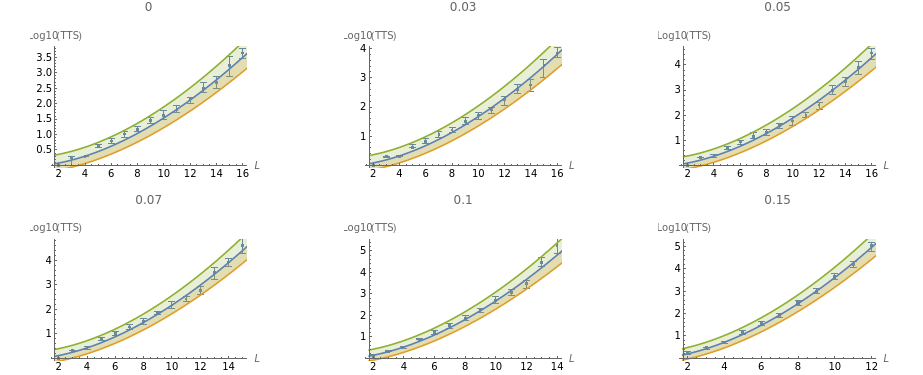
Cite this as: Adam Pearson, Daniel Lidar, "Data Collapse from Analog Errors in Quantum Annealing: Doom and Hope" from the Notebook Archive (2019), https://notebookarchive.org/2019-10-ana4eit
Download
