Stability Map for CCS Case
Author
Steffen Berg, Jos Maas, Niels Springer, Albert Hebing, Jeroen Snippe
Title
Stability Map for CCS Case
Description
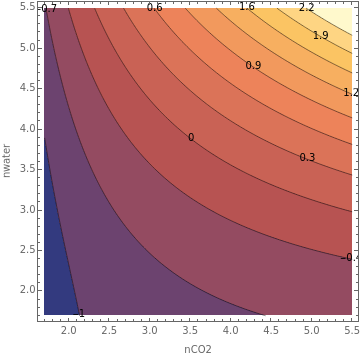
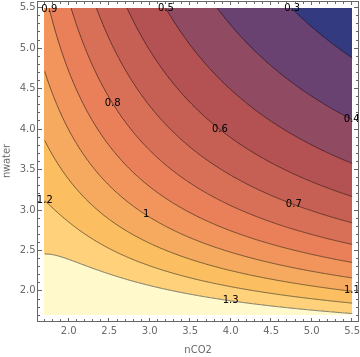
stability maps, Fig. 4 and 5 from Maas et al. International Journal of Greenhouse Gas Control 132, 104074, 2024
Category
Academic Articles & Supplements
Keywords
viscous fingering, porous media
URL
http://www.notebookarchive.org/2024-04-2shelzs/
DOI
https://notebookarchive.org/2024-04-2shelzs
Date Added
2024-04-06
Date Last Modified
2024-04-06
File Size
3.94 megabytes
Supplements
Rights
CC BY-NC-SA 4.0

Stability Map for CCS Case
Stability Map for CCS Case
Steffen Berg, Jos Maas, Niels Springer, Albert Hebing andJeroen Snippe
Viscous Fingering in CCS - A General Criterion for Viscous Fingering in Porous MediaInternational Journal of Greenhouse Gas Control 132, 104074, 2024
Viscosity and Relperm Definitions
Viscosity and Relperm Definitions
w = displacing fluid = fluid 1=CO2
o = displaced fluid = fluid 2=water
o = displaced fluid = fluid 2=water
In[]:=
muw=0.0338;muo=0.674;Scw=0.00;Sor=0.20;Krwor=0.5;Krocw=1.0;nw=3.7;no=2.5;
In[]:=
kro=Krocw*((1-Sw-Sor)/(1-Scw-Sor))^no;
In[]:=
krw=Krwor*((Sw-Scw)/(1-Scw-Sor))^nw;
In[]:=
relpermlinplot=Plot[{krw,kro},{Sw,Scw,1-Sor},FrameTrue,AxesFalse,PlotRange{{0,1},{10^(-6),1}},PlotStyle{RGBColor[0,0,1],RGBColor[1,0,0]},FrameLabel{"water saturation Sw","relative permeability kr"}];
In[]:=
relpermlogplot=LogPlot[{krw,kro},{Sw,Scw,1-Sor},FrameTrue,AxesFalse,PlotRange{{0,1},{10^(-5),1}},PlotStyle{RGBColor[0,0,1],RGBColor[1,0,0]},FrameLabel{"water saturation Sw","relative permeability kr"}];
In[]:=
GraphicsRow[{relpermlinplot,relpermlogplot},Spacings->Scaled[0.2],Epilog->Inset["",Scaled[{0.5,0.95}]]]
Out[]=

Fractional Flow
Fractional Flow
In[]:=
fw=1/(1+(kro*muw)/(krw*muo));
In[]:=
fwS=D[fw,Sw];
In[]:=
Plot[{fw},{Sw,Scw,1-Sor},FrameTrue,AxesFalse,PlotRange{{0,1},{0,1}},PlotStyle{RGBColor[0,0,0]},FrameLabel{"CO2 saturation","fractional flow fw"}]
Out[]=

In[]:=
Sred=Sw-Scw;
In[]:=
Plot[{fwS,fw/Sred},{Sw,Scw,1-Sor},FrameTrue,AxesFalse,PlotRange{{0,1},All},PlotStyle{RGBColor[0,0,1],RGBColor[1,0,0]},FrameLabel{"Sw","fw"}];
In[]:=
diff=fwS-fw/Sred;
In[]:=
Plot[{diff},{Sw,Scw,1-Sor},FrameTrue,AxesFalse,PlotRange{{0,1},All},PlotStyle{RGBColor[0,0,0]},FrameLabel{"Sw","fw"}];
Breakthrough Saturation and Recovery
Breakthrough Saturation and Recovery
In[]:=
Swbt=Sw/.FindRoot[diff0,{Sw,Scw+0.05,1-Sor}][[1]]
Out[]=
0.413902
In[]:=
FwSwbt=fw/.Sw->Swbt
Out[]=
0.843261
In[]:=
Recbt=1/fwS/.SwSwbt
Out[]=
0.490835
In[]:=
Swavbt=Swbt+(1-FwSwbt)*Recbt
Out[]=
0.490835
In[]:=
watercutsurf=1/(1+(Swbt/Swavbt)*((1/FwSwbt)-1))
Out[]=
0.864499
In[]:=
Pvinject=(Recbt(Sw-Scw)/(Swbt-Scw))*UnitStep[-(Sw-Swbt)]+(1/fwS)*UnitStep[Sw-Swbt];
In[]:=
Plot[{Pvinject},{Sw,Scw,1-Sor},FrameTrue,AxesFalse,PlotRange{{0,1},{0,6}},PlotStyle{RGBColor[0,0,0]},FrameLabel{"Sw","injected PV"}];
In[]:=
Pvproduced=(Recbt(Sw-Scw)/(Swbt-Scw))*UnitStep[Swbt-Sw]+(Sw-Scw+(1-fw)/fwS)*UnitStep[Sw-Swbt];
In[]:=
Plot[{Pvproduced},{Sw,Scw,1-Sor},FrameTrue,AxesFalse,PlotRange{{0,1},All},PlotStyle{RGBColor[0,0,0]},FrameLabel{"Sw","produced PV"}];
In[]:=
prodata=Table[{Pvinject,Pvproduced},{Sw,Scw+0.001,1-Sor,0.01}];
In[]:=
ParametricPlot[{Pvinject,Pvproduced},{Sw,Scw+0.001,1-Sor},FrameTrue,AxesFalse,PlotRange{{0,5},{0,1}}];
In[]:=
ListPlot[prodata,FrameTrue,AxesFalse,PlotRange{{0,10},{0,1}},JoinedTrue,FrameLabel{"injected PV","Produced PV"}]
Out[]=

In[]:=
Recbt5=Pvproduced/.FindRoot[1/fwS-50,{Sw,Swbt}][[1]]
Out[]=
0.644004
Mobility Ratios
Mobility Ratios
Endpoint
In[]:=
M=Krwormuo/(Krocwmuw)
Out[]=
9.97041
Shock front Hagoort
In[]:=
Ms=((kro/.SwSwbt)/muo+(krw/.SwSwbt)/muw)/(Krocw/muo)
Out[]=
1.03238
In[]:=
Schock=UnitStep[-(Sw-Swavbt)](Sw-Scw)/(Swavbt-Scw)+UnitStep[Sw-Swavbt];
In[]:=
Plot[{fw,Schock},{Sw,Scw,1-Sor},FrameTrue,AxesFalse,PlotRange{{0,1},{0,1.02}},PlotStyle{RGBColor[0,0,1],RGBColor[1,0,0]},FrameLabel{"CO2 saturation","fw"}]
Out[]=

Alpha
Alpha


In[]:=
R=1/(krw/muw+kro/muo);
In[]:=
Rprime=D[R,Sw];
In[]:=
fwprime=fwS;
In[]:=
Sfr=Swbt;
In[]:=
term1=NIntegrate[fwprime*Rprime,{Sw,1-Sor,Sfr}]
Out[]=
0.461597
In[]:=
term2=fwprime/.SwSfr
Out[]=
2.03734
In[]:=
term3=R/.SwSfr
Out[]=
0.652858
In[]:=
term4=1/(Krwor/muw)
Out[]=
0.0676
In[]:=
alpha=term1/(term2*(term3-term4))
Out[]=
0.387125
Ms, MHagoort, and dG/dt
Ms, MHagoort, and dG/dt
for relperm and viscosity ratio from Berg & Ott 2011 paper
In[]:=
muw=0.0338;muo=0.674;Scw=0.00;Sor=0.20;Krwor=0.5;Krocw=1.0;nw=3.7;no=2.5;kro=Krocw*((1-Sw-Sor)/(1-Scw-Sor))^no;krw=Krwor*((Sw-Scw)/(1-Scw-Sor))^nw;fw=1/(1+(kro*muw)/(krw*muo));fwS=D[fw,Sw];Sred=Sw-Scw;diff=fwS-fw/Sred;Swbt=Sw/.FindRoot[diff0,{Sw,Scw+0.05,1-Sor}][[1]];R=1/(krw/muw+kro/muo);Rprime=D[R,Sw];fwprime=fwS;Sfr=Swbt;
In[]:=
R=1/(krw/muw+kro/muo);
In[]:=
Rprime=D[R,Sw];
In[]:=
fwprime=fwS;
In[]:=
Sfr=Swbt;
dG/dt criteria
In[]:=
dGdt=-NIntegrate[fwprime*Rprime,{Sw,1-Sor,Sfr}]+((R/.SwSfr)-1/(Krocw/muo))*(fwprime/.SwSfr)
Out[]=
-0.504669
Endpoint mobility ratio Mend
In[]:=
Mend=(Krwor/muw)/(Krocw/muo)
Out[]=
9.97041
Hagoort mobility ratio MHagoort
In[]:=
Mhag=((kro/.SwSfr)/muo+(krw/.SwSfr)/muw)/(Krocw/muo)
Out[]=
1.03238
Shock front mobility ratio Msf
In[]:=
Msf=((krw/.SwSfr)/muw)/(Krocw/muo)
Out[]=
0.870568
alpha
In[]:=
alpha=NIntegrate[fwprime*Rprime,{Sw,1-Sor,Sfr}]/((fwprime/.SwSfr)*((R/.SwSfr)-(1/(Krwor/muw))))
Out[]=
0.387125
Malpha

In[]:=
Malpha=(1-alpha)/(1-alpha/Mend)
Out[]=
0.637633

In[]:=
1/Mhag-1/Malpha
Out[]=
-0.599668
dG/dt as a function of CO2 viscosity
dG/dt as a function of CO2 viscosity
Calculation of dG/dt in one cell
In[]:=
muw=0.0338;muo=0.674;Scw=0.00;Sor=0.20;Krwor=0.5;Krocw=1.0;nw=3.7;no=2.5;kro=Krocw*((1-Sw-Sor)/(1-Scw-Sor))^no;krw=Krwor*((Sw-Scw)/(1-Scw-Sor))^nw;fw=1/(1+(kro*muw)/(krw*muo));fwS=D[fw,Sw];Sred=Sw-Scw;diff=fwS-fw/Sred;Swbt=Sw/.FindRoot[diff0,{Sw,Scw+0.05,1-Sor}][[1]];R=1/(krw/muw+kro/muo);Rprime=D[R,Sw];fwprime=fwS;Sfr=Swbt;dGdt=-NIntegrate[fwprime*Rprime,{Sw,1-Sor,Sfr}]+((R/.SwSfr)-1/(Krocw/muo))*(fwprime/.SwSfr)
Out[]=
-0.504669
In[]:=
min=1.0;max=10.0;
In[]:=
dGdttab=Table[{i,i},{i,min,max,1}];
In[]:=
Do[muw=1/i;muo=1;Scw=0.00;Sor=0.20;Krwor=0.5;Krocw=1.0;nw=3.7;no=2.5;kro=Krocw*((1-Sw-Sor)/(1-Scw-Sor))^no;krw=Krwor*((Sw-Scw)/(1-Scw-Sor))^nw;fw=1/(1+(kro*muw)/(krw*muo));fwS=D[fw,Sw];Sred=Sw-Scw;diff=fwS-fw/Sred;Swbt=Sw/.FindRoot[diff0,{Sw,Scw+0.05,1-Sor}][[1]];R=1/(krw/muw+kro/muo);Rprime=D[R,Sw];fwprime=fwS;Sfr=Swbt;dGdt=-NIntegrate[fwprime*Rprime,{Sw,1-Sor,Sfr}]+((R/.SwSfr)-1/(Krocw/muo))*(fwprime/.SwSfr);dGdttab[[i]][[1]]=i;dGdttab[[i]][[2]]=dGdt;,{i,min,max}]
In[]:=
zeroline=Table[{i,0},{i,min,max,1}];
In[]:=
ListPlot[{dGdttab,zeroline},FrameTrue,AxesFalse,PlotRange{{min,max},{-3,3}},JoinedTrue,FrameLabel{"viscosity ratio","dGdt"},PlotStyle{{RGBColor[0,0,1]},{RGBColor[0,0,0],Thickness[0.002],Dashed}}]
Out[]=

logarithmic viscosity ratio
In[]:=
min=1;max=100.0;imin=1;imax=50;b=Log[min/max]/(imin-imax);a=min/Exp[b];
In[]:=
dGdttab=Table[{a*Exp[b*i],i},{i,imin,imax,1}];
In[]:=
Do[muw=1/(a*Exp[b*i]);muo=1;Scw=0.00;Sor=0.20;Krwor=0.5;Krocw=1.0;nw=3.7;no=2.5;kro=Krocw*((1-Sw-Sor)/(1-Scw-Sor))^no;krw=Krwor*((Sw-Scw)/(1-Scw-Sor))^nw;fw=1/(1+(kro*muw)/(krw*muo));fwS=D[fw,Sw];Sred=Sw-Scw;diff=fwS-fw/Sred;Swbt=Sw/.FindRoot[diff0,{Sw,Scw+0.05,1-Sor}][[1]];R=1/(krw/muw+kro/muo);Rprime=D[R,Sw];fwprime=fwS;Sfr=Swbt;dGdt=-NIntegrate[fwprime*Rprime,{Sw,1-Sor,Sfr}]+((R/.SwSfr)-1/(Krocw/muo))*(fwprime/.SwSfr);dGdttab[[i]][[1]]=a*Exp[b*i];dGdttab[[i]][[2]]=dGdt;,{i,imin,imax}]
In[]:=
zeroline=Table[{a*Exp[b*i],0},{i,imin,imax,1}];
In[]:=
Plot1=ListLogLinearPlot[{dGdttab,zeroline},FrameTrue,AxesFalse,PlotRange{{min,max},{-10,5}},JoinedTrue,FrameLabel{"viscosity ratio","dGdt"},PlotStyle{{RGBColor[0,0,1]},{RGBColor[0,0,0],Thickness[0.002],Dashed}}]
Out[]=

dG/dt as a function of water endpoint relperm
dG/dt as a function of water endpoint relperm
In[]:=
min=1.0;max=10.0;
In[]:=
dGdttab=Table[{i,i},{i,min,max,1}];
In[]:=
Do[muw=0.0338;muo=0.674;Scw=0.00;Sor=0.20;Krwor=0.5;Krocw=0.1*i;nw=3.7;no=2.5;kro=Krocw*((1-Sw-Sor)/(1-Scw-Sor))^no;krw=Krwor*((Sw-Scw)/(1-Scw-Sor))^nw;fw=1/(1+(kro*muw)/(krw*muo));fwS=D[fw,Sw];Sred=Sw-Scw;diff=fwS-fw/Sred;Swbt=Sw/.FindRoot[diff0,{Sw,Scw+0.05,1-Sor}][[1]];R=1/(krw/muw+kro/muo);Rprime=D[R,Sw];fwprime=fwS;Sfr=Swbt;dGdt=-NIntegrate[fwprime*Rprime,{Sw,1-Sor,Sfr}]+((R/.SwSfr)-1/(Krocw/muo))*(fwprime/.SwSfr);dGdttab[[i]][[1]]=0.1*i;dGdttab[[i]][[2]]=dGdt;,{i,min,max}]
In[]:=
zeroline=Table[{0.1*i,0},{i,min,max,1}];
In[]:=
ListPlot[{dGdttab,zeroline},FrameTrue,AxesFalse,PlotRange{{0.1,1},{-20,20}},JoinedTrue,FrameLabel{"water endpoint relative permeability","dGdt"},PlotStyle{{RGBColor[0,0,1]},{RGBColor[0,0,0],Thickness[0.002],Dashed}}]
Out[]=

logarithmic endpoint relative permeability ratio
In[]:=
min=0.1;max=1.0;imin=1;imax=30;b=Log[min/max]/(imin-imax);a=min/Exp[b];
In[]:=
Plot[a*Exp[b*i],{i,imin,imax},Frame->True,Axes->false];
In[]:=
dGdttab=Table[{a*Exp[b*i],i},{i,imin,imax,1}];
In[]:=
Do[muw=0.0338;muo=0.674;Scw=0.00;Sor=0.20;Krwor=0.5;Krocw=a*Exp[b*i];nw=3.7;no=2.5;kro=Krocw*((1-Sw-Sor)/(1-Scw-Sor))^no;krw=Krwor*((Sw-Scw)/(1-Scw-Sor))^nw;fw=1/(1+(kro*muw)/(krw*muo));fwS=D[fw,Sw];Sred=Sw-Scw;diff=fwS-fw/Sred;Swbt=Sw/.FindRoot[diff0,{Sw,Scw+0.05,1-Sor}][[1]];R=1/(krw/muw+kro/muo);Rprime=D[R,Sw];fwprime=fwS;Sfr=Swbt;dGdt=-NIntegrate[fwprime*Rprime,{Sw,1-Sor,Sfr}]+((R/.SwSfr)-1/(Krocw/muo))*(fwprime/.SwSfr);dGdttab[[i]][[1]]=a*Exp[b*i];dGdttab[[i]][[2]]=dGdt;,{i,imin,imax}]
In[]:=
zeroline=Table[{a*Exp[b*i],0},{i,imin,imax,1}];
In[]:=
Plot1=ListLogLinearPlot[{dGdttab,zeroline},FrameTrue,AxesFalse,PlotRange{{min,max},{-20,20}},JoinedTrue,FrameLabel{"water endpoint relative permeability","dGdt"},PlotStyle{{RGBColor[0,0,1]},{RGBColor[0,0,0],Thickness[0.002],Dashed}}]
Out[]=

dGdt map (viscosity ratio, water endpoint relative permeability)
dGdt map (viscosity ratio, water endpoint relative permeability)
In[]:=
mumin=1;mumax=20;krrmin=1;krrmax=10;step=0.1;dGdttab2={};
In[]:=
Do[muw=1/i;muo=1;Scw=0.00;Sor=0.20;Krwor=0.1*j;Krocw=1.0;nw=3.7;no=2.5;kro=Krocw*((1-Sw-Sor)/(1-Scw-Sor))^no;krw=Krwor*((Sw-Scw)/(1-Scw-Sor))^nw;fw=1/(1+(kro*muw)/(krw*muo));fwS=D[fw,Sw];Sred=Sw-Scw;diff=fwS-fw/Sred;Swbt=Sw/.FindRoot[diff0,{Sw,Scw+0.05,1-Sor}][[1]];R=1/(krw/muw+kro/muo);Rprime=D[R,Sw];fwprime=fwS;Sfr=Swbt;dGdt=-NIntegrate[fwprime*Rprime,{Sw,1-Sor,Sfr}]+((R/.SwSfr)-1/(Krocw/muo))*(fwprime/.SwSfr);AppendTo[dGdttab2,{i,0.1*j,dGdt}];,{i,mumin,mumax,step},{j,krrmin,krrmax,step}]
In[]:=
ListContourPlot[dGdttab2,FrameLabel{"brine / CO2 viscosity","CO2 endpoint relative permeability"},ContourLabelsAll,PlotRange->All,PlotLegendsAutomatic,Contours->{-1,-0.8,-0.5,0,0.5,1,2,3,4,6,8,10,12}]
Out[]=
 |
dG/dt for Exp. 3 from Berg & Ott 2021
dG/dt for Exp. 3 from Berg & Ott 2021
Calculation of dG/dt in one cell
In[]:=
muw=0.0338;muo=0.674;Scw=0.00;Sor=0.20;Krwor=0.5;Krocw=1.0;nw=3.7;no=2.5;kro=Krocw*((1-Sw-Sor)/(1-Scw-Sor))^no;krw=Krwor*((Sw-Scw)/(1-Scw-Sor))^nw;fw=1/(1+(kro*muw)/(krw*muo));fwS=D[fw,Sw];Sred=Sw-Scw;diff=fwS-fw/Sred;Swbt=Sw/.FindRoot[diff0,{Sw,Scw+0.05,1-Sor}][[1]];R=1/(krw/muw+kro/muo);Rprime=D[R,Sw];fwprime=fwS;Sfr=Swbt;dGdt=-NIntegrate[fwprime*Rprime,{Sw,1-Sor,Sfr}]+((R/.SwSfr)-1/(Krocw/muo))*(fwprime/.SwSfr)
Out[]=
-0.504669
Msf map (viscosity ratio, water endpoint relative permeability)
Msf map (viscosity ratio, water endpoint relative permeability)
In[]:=
mumin=1;mumax=20;krrmin=1;krrmax=10;step=0.1;Msftab2={};
In[]:=
Do[muw=1/i;muo=1;Scw=0.00;Sor=0.20;Krwor=0.1*j;Krocw=1.0;nw=3.7;no=2.5;kro=Krocw*((1-Sw-Sor)/(1-Scw-Sor))^no;krw=Krwor*((Sw-Scw)/(1-Scw-Sor))^nw;fw=1/(1+(kro*muw)/(krw*muo));fwS=D[fw,Sw];Sred=Sw-Scw;diff=fwS-fw/Sred;Swbt=Sw/.FindRoot[diff0,{Sw,Scw+0.05,1-Sor}][[1]];R=1/(krw/muw+kro/muo);Rprime=D[R,Sw];fwprime=fwS;Sfr=Swbt;Msf=((krw/.SwSfr)/muw)/(Krocw/muo);AppendTo[Msftab2,{i,0.1*j,Msf}];,{i,mumin,mumax,step},{j,krrmin,krrmax,step}]
In[]:=
ListContourPlot[Msftab2,FrameLabel{"brine / CO2 viscosity","CO2 endpoint relative permeability"},ContourLabelsAll,PlotRange->All,PlotLegendsAutomatic]
Out[]=
 |
MHagoort map (viscosity ratio, water endpoint relative permeability)
MHagoort map (viscosity ratio, water endpoint relative permeability)
In[]:=
mumin=1;mumax=20;krrmin=1;krrmax=10;step=0.1;Mhagtab2={};
In[]:=
Do[muw=1/i;muo=1;Scw=0.00;Sor=0.20;Krwor=0.1*j;Krocw=1.0;nw=3.7;no=2.5;kro=Krocw*((1-Sw-Sor)/(1-Scw-Sor))^no;krw=Krwor*((Sw-Scw)/(1-Scw-Sor))^nw;fw=1/(1+(kro*muw)/(krw*muo));fwS=D[fw,Sw];Sred=Sw-Scw;diff=fwS-fw/Sred;Swbt=Sw/.FindRoot[diff0,{Sw,Scw+0.05,1-Sor}][[1]];R=1/(krw/muw+kro/muo);Rprime=D[R,Sw];fwprime=fwS;Sfr=Swbt;Mhag=((kro/.SwSfr)/muo+(krw/.SwSfr)/muw)/(Krocw/muo);AppendTo[Mhagtab2,{i,0.1*j,Mhag}];,{i,mumin,mumax,step},{j,krrmin,krrmax,step}]
In[]:=
ListContourPlot[Mhagtab2,FrameLabel{"brine / CO2 viscosity","CO2 endpoint relative permeability"},ContourLabelsAll,PlotRange->All,PlotLegendsAutomatic]
Out[]=
 |
Stability map as a function of Corey exponents
Stability map as a function of Corey exponents
dG/dt criteria
In[]:=
nwmin=1;nwmax=20;nomin=1;nomax=20;step=0.1;dGdttab2={};
In[]:=
Do[muw=0.0338;muo=0.674;Scw=0.00;Sor=0.20;Krwor=0.5;Krocw=1.0;nw=1.5+0.2*i;no=1.5+0.2*j;kro=Krocw*((1-Sw-Sor)/(1-Scw-Sor))^no;krw=Krwor*((Sw-Scw)/(1-Scw-Sor))^nw;fw=1/(1+(kro*muw)/(krw*muo));fwS=D[fw,Sw];Sred=Sw-Scw;diff=fwS-fw/Sred;Swbt=Sw/.FindRoot[diff0,{Sw,Scw+0.05,1-Sor}][[1]];R=1/(krw/muw+kro/muo);Rprime=D[R,Sw];fwprime=fwS;Sfr=Swbt;dGdt=-NIntegrate[fwprime*Rprime,{Sw,1-Sor,Sfr}]+((R/.SwSfr)-1/(Krocw/muo))*(fwprime/.SwSfr);AppendTo[dGdttab2,{1.5+0.2*i,1.5+0.2*j,dGdt}];,{i,nwmin,nwmax,step},{j,nomin,nomax,step}]
In[]:=
ListContourPlot[dGdttab2,FrameLabel{"nCO2","nwater"},ContourLabelsAll,PlotRange->All,PlotLegendsAutomatic,Contours->11]
Out[]=
 |  |
MHagoort criteria
In[]:=
nwmin=1;nwmax=20;nomin=1;nomax=20;step=0.1;Mhagtab2={};
In[]:=
Do[muw=0.0338;muo=0.674;Scw=0.00;Sor=0.20;Krwor=0.5;Krocw=1.0;nw=1.5+0.2*i;no=1.5+0.2*j;kro=Krocw*((1-Sw-Sor)/(1-Scw-Sor))^no;krw=Krwor*((Sw-Scw)/(1-Scw-Sor))^nw;fw=1/(1+(kro*muw)/(krw*muo));fwS=D[fw,Sw];Sred=Sw-Scw;diff=fwS-fw/Sred;Swbt=Sw/.FindRoot[diff0,{Sw,Scw+0.05,1-Sor}][[1]];R=1/(krw/muw+kro/muo);Rprime=D[R,Sw];fwprime=fwS;Sfr=Swbt;Mhag=((kro/.SwSfr)/muo+(krw/.SwSfr)/muw)/(Krocw/muo);AppendTo[Mhagtab2,{1.5+0.2*i,1.5+0.2*j,Mhag}];,{i,nwmin,nwmax,step},{j,nomin,nomax,step}]
In[]:=
ListContourPlot[Mhagtab2,FrameLabel{"nCO2","nwater"},ContourLabelsAll,PlotRange->All,PlotLegendsAutomatic,Contours->11]
Out[]=
 |
Msf criteria
In[]:=
nwmin=1;nwmax=20;nomin=1;nomax=20;step=0.1;Msftab2={};
In[]:=
Do[muw=0.0338;muo=0.674;Scw=0.00;Sor=0.20;Krwor=0.5;Krocw=1.0;nw=1.5+0.2*i;no=1.5+0.2*j;kro=Krocw*((1-Sw-Sor)/(1-Scw-Sor))^no;krw=Krwor*((Sw-Scw)/(1-Scw-Sor))^nw;fw=1/(1+(kro*muw)/(krw*muo));fwS=D[fw,Sw];Sred=Sw-Scw;diff=fwS-fw/Sred;Swbt=Sw/.FindRoot[diff0,{Sw,Scw+0.05,1-Sor}][[1]];R=1/(krw/muw+kro/muo);Rprime=D[R,Sw];fwprime=fwS;Sfr=Swbt;Msf=((krw/.SwSfr)/muw)/(Krocw/muo);AppendTo[Msftab2,{1.5+0.2*i,1.5+0.2*j,Msf}];,{i,nwmin,nwmax,step},{j,nomin,nomax,step}]
In[]:=
ListContourPlot[Msftab2,FrameLabel{"nCO2","nwater"},ContourLabelsAll,PlotRange->All,PlotLegendsAutomatic,Contours->11]
Out[]=
 |  |
Cite this as: Steffen Berg, Jos Maas, Niels Springer, Albert Hebing, Jeroen Snippe, "Stability Map for CCS Case" from the Notebook Archive (2024), https://notebookarchive.org/2024-04-2shelzs
Download
