When blood needs to flow: The role of the complement system in red blood cell clearance during immune responses
Author
Clemente Fernández Arias
Title
When blood needs to flow: The role of the complement system in red blood cell clearance during immune responses
Description
Supplementary material for "When blood needs to flow: The role of the complement system in red blood cell clearance during immune responses"
Category
Academic Articles & Supplements
Keywords
URL
http://www.notebookarchive.org/2025-05-2sa0yis/
DOI
https://notebookarchive.org/2025-05-2sa0yis
Date Added
2025-05-06
Date Last Modified
2025-05-06
File Size
2.42 megabytes
Supplements
Rights
CC BY 4.0

Supplementary material to
“When blood needs to flow: complement-mediated red blood cell clearance during immune responses ” (2025)
Supplementary material to
“When blood needs to flow: complement-mediated red blood cell clearance during immune responses ” (2025)
“When blood needs to flow: complement-mediated red blood cell clearance during immune responses ” (2025)
Clemente F. Arias1*, Agustín Tortajada2, Francisco J. Acosta3, and Cristina Fernández-Arias2*
Clemente F. Arias, Agustín Tortajada, Francisco J. Acosta, and Cristina Fernández-Arias
1*
2
3
2*
This notebook contains the code used to generate Figs. 3-5 in the main text.
This notebook contains the code used to generate Figs. 3-5 in the main text.
Figure 2
Figure 2
Equations 1:
In[]:=
Clear[equations1];equations1[{r0_,λ_,μ_},{δ_,k1_,k2_}]:=NDSolve[{c3b'[t]==δt-k1r[t]c3b[t],ic3b'[t]==k1r[t]c3b[t]-k2ic3b[t]r[t],c3dg'[t]==k2ic3b[t]r[t],r'[t]==-λ(r[t]-μ),r[0]==r0,c3b[0]==0,ic3b[0]==0,c3dg[0]==0},{c3b[t],ic3b[t],c3dg[t],r[t]},{t,0,100000}];
In[]:=
fig[{r0_,λ_,μ_},{δ_,k1_,k2_}]:=Plot[{Evaluate[c3b[t]/.equations1[{r0,λ,μ},{δ,k1,k2}]],Evaluate[ic3b[t]/.equations1[{r0,λ,μ},{δ,k1,k2}]],Evaluate[c3dg[t]/.equations1[{r0,λ,μ},{δ,k1,k2}]]},{t,0,100},PlotRange->All,Ticks->False](*PlotthedynamicsofcomplementfragmentsC3b,iC3b,andC3dgaccordingtoequations1*)
In[]:=
fig1AB=GraphicsGrid[{{Plot[{Evaluate[r[t]/.equations1[{5,.05,1},{.1,.1,1}]]},{t,0,150},Ticks->False,AxesOrigin->{0,0},PlotRange->{0,6}],fig[{5,.05,1},{1,.01,1}],fig[{5,.05,1},{.2,10,.01}],fig[{5,.05,1},{.1,10,.1}]}},ImageSize->1000](*Dynamicsofcomplementregulators(left)andcomplementfragmentsforthreedifferentparametervalues*)
Out[]=
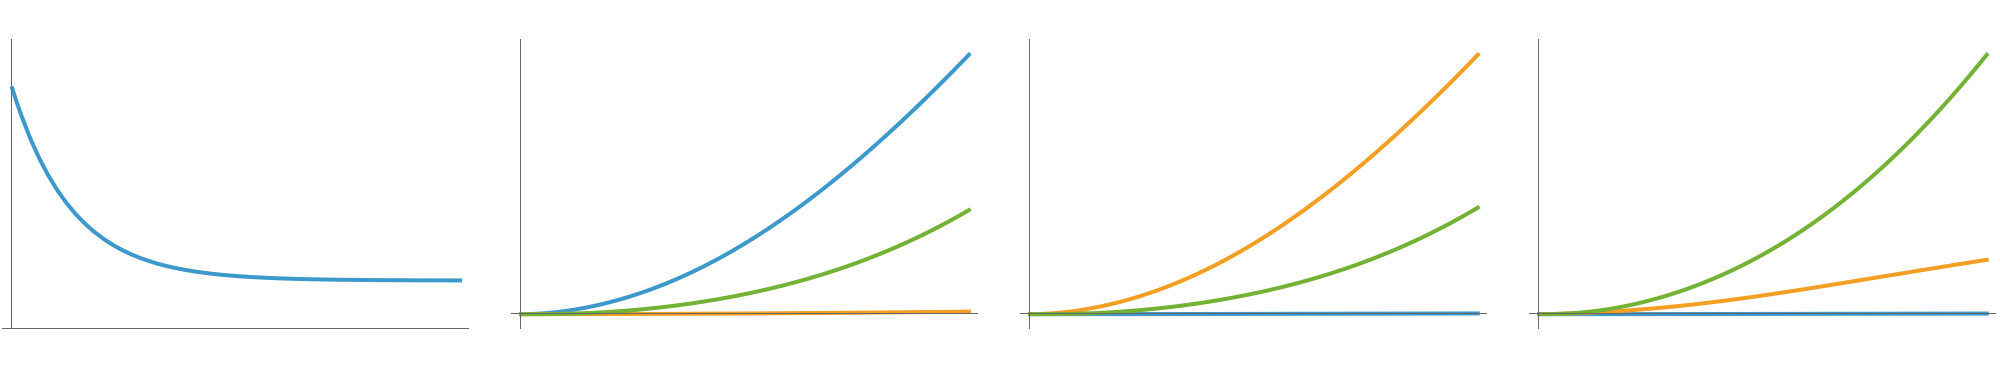
Figure 3
Figure 3
Equations 5:
In[]:=
Clear[equations5];equations5[{r0_,λ_,μ_},{δ_,k1_,k2_},{c0_,λC_,μC_,ρ_},{t0_,t1_,α_}]:=NDSolve[{c3b'[t]==If[t0<t<t1,αδt,δt]-k1r[t]c3b[t],ic3b'[t]==k1r[t]c3b[t]-k2ic3b[t]r[t],c3dg'[t]==k2ic3b[t]r[t],r'[t]==-λ(r[t]-μ),cd47'[t]-λC(cd47[t]-μC),ps'[t]ρ,r[0]==r0,cd47[0]==c0,ps[0]==0,c3b[0]==0,ic3b[0]==0,c3dg[0]==0},{c3b,ic3b,c3dg,r,cd47,ps},{t,0,1000}];
In[]:=
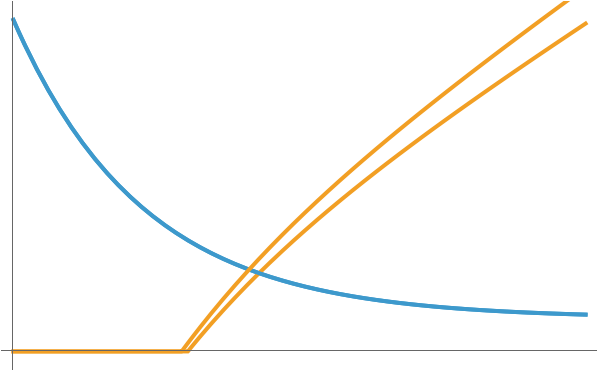
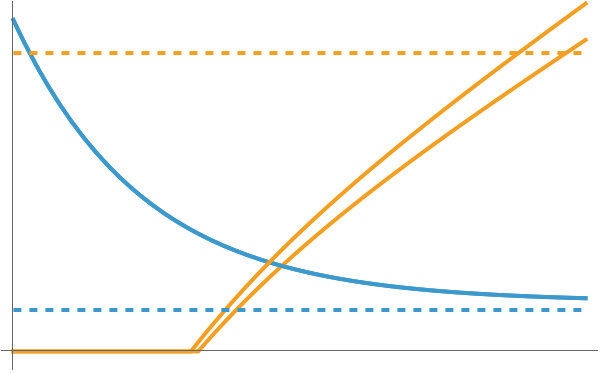
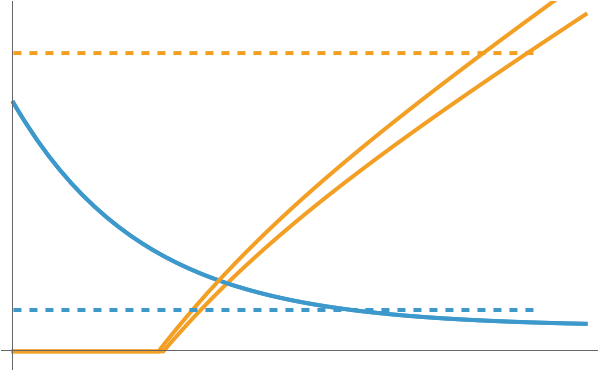
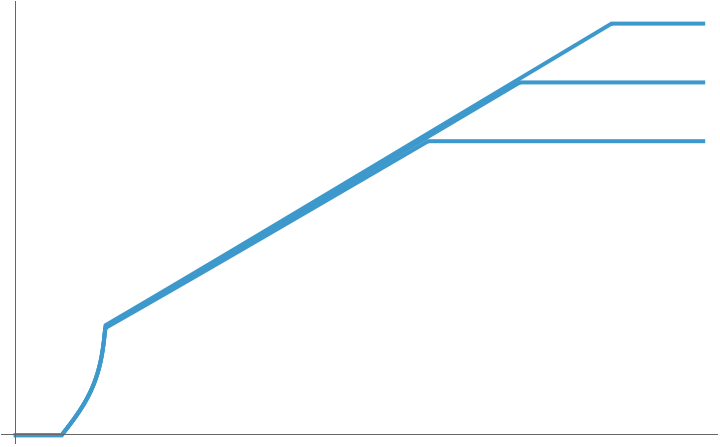
fig3[{r0_,λ_,μ_},{δ_,k1_,k2_},{c0_,λC_,μC_,ρ_},{sirp_,pr_,cr_},{t0_,t1_,α_}]:=Plot[{Evaluate[(cd47[t]/.equations5[{r0,λ,μ},{δ,k1,k2},{c0,λC,μC,ρ},{t0,t1,α}])],Evaluate[Max[0,Evaluate[-(sirpcd47[t]/.equations5[{r0,λ,μ},{δ,k1,k2},{c0,λC,μC,ρ},{t0,t1,α}])+pr(ps[t]/.equations5[{r0,λ,μ},{δ,k1,k2},{c0,λC,μC,ρ},{t0,t1,α}])+cric3b[t]/.equations5[{r0,λ,μ},{δ,k1,k2},{c0,λC,μC,ρ},{t0,t1,α}]]]]},{t,0,220},ImageSize->300](*Plotsthedynamicsofeat-mesignals(CD47)anddon't-eat-mesignals(PS+iC3b)inthemembraneofasingleredbloodcell*)
In[]:=
fig3A=Show[fig3[{100,.05,10},{0,20,.1},{200,.02,20,2},{1,.5,0},{0,0,0}],fig3[{100,.05,10},{.2,20,.1},{200,.02,20,2},{1,.5,.5},{0,0,0}],Ticks->False]
Out[]=
In[]:=
fig3B=Show[fig3[{100,.05,10},{0,20,.1},{200,.02,30,2},{1,.5,.5},{0,0,0}],fig3[{100,.05,10},{.2,20,.1},{200,.02,30,2},{1,.5,.5},{0,0,0}],Plot[{25,180},{t,0,220},PlotStyle->Dashed],AxesOrigin->{0,0},PlotRange->{0,200},Ticks->False]
Out[]=
In[]:=
fig3C=Show[fig3[{100,.05,10},{0,20,.1},{150,.02,15,2},{1,.5,.5},{0,0,0}],fig3[{100,.05,10},{.2,20,.1},{150,.02,15,2},{1,.5,.5},{0,0,0}],Plot[{25,180},{t,0,200},PlotStyle->Dashed],AxesOrigin->{0,0},PlotRange->{0,200},Ticks->False]
Out[]=
In[]:=
fig3F=Show[fig3[{100,.05,10},{.2,20,.1},{200,.02,30,2},{1,.5,.5},{1,1,1}],fig3[{100,.05,10},{1,20,.1},{200,.02,30,2},{1,.5,.5},{1,1,1}],Plot[{25,180},{t,0,220},PlotStyle->Dashed],Ticks->False]
Out[]=
In[]:=
Clear[modelLifespan];modelLifespan[{r0_,λ_,μ_},{δ_,k1_,k2_},{c0_,λC_,μC_,ρ_},{sirp_,pr_,cr_},{HT_,IT_,LT_},{t0_,t1_,α_}]:=(If[sirpc0<=IT,fate=1;lifespan=0,NDSolve[{c3b'[t]==If[t0<t<t1,αδt,δt]-k1r[t]c3b[t],ic3b'[t]==k1r[t]c3b[t]-k2ic3b[t]r[t],c3dg'[t]==k2ic3b[t]r[t],r'[t]==-λ(r[t]-μ),cd47'[t]-λC(cd47[t]-μC),ps'[t]ρ,r[0]==r0,cd47[0]==c0,ps[0]==0,c3b[0]==0,ic3b[0]==0,c3dg[0]==0,WhenEvent[(sirpcd47[t])<IT,fate=1;lifespan=t;"StopIntegration"],WhenEvent[c3b[t]>LT,macs=1;fate=2;lifespan=t;"StopIntegration"],WhenEvent[-sirpcd47[t]+prps[t]+cric3b[t]>HT,fate=3;lifespan=t;"StopIntegration"]},{c3b,ic3b,c3dg,r,cd47,ps},{t,0,10000}]];{fate,lifespan});(*Numericalsimulationsofequations5.Integrationstopswhentheredbloodcellisphagocytized.Therearethreeprossiblephagocytosispathways.Thefirstoneoccurswhenthelevelsofdon't-eat-mesignalsfallsbelowathresholdIT;thesecondoneislysis,whichoccursifC3blevelsexceedathresholdLT;thelastonetakesplaceifthedifferencebetweeneat-meanddon't-eat-mesignalsexceedsathresholdHT.Thisfunctionreturnsthephagocytosispathwayandtheredbloodcelllifespan*)
In[]:=
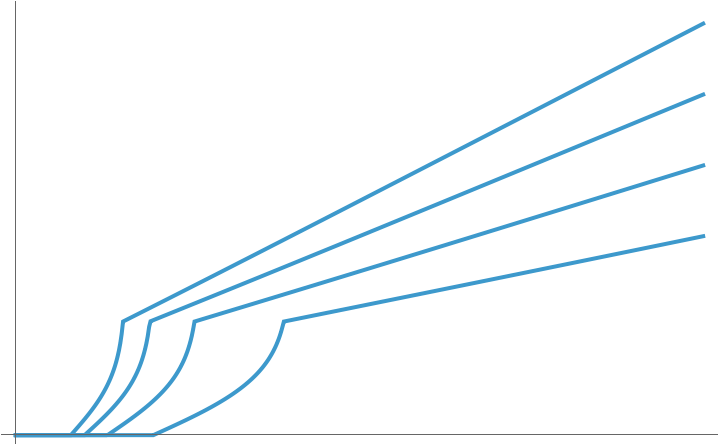
fig3D=Show[Table[ListLinePlot[Table[{c0,modelLifespan[{100,.05,10},{.2,20,.1},{c0,.02,.5c0,2},{rr,2,2},{400,400,100},{0,0,0}][[2]]},{c0,0,1000,2}],PlotRange->All],{rr,2,5}],PlotRange->All,Ticks->False](*EffectofCD47levelsonnewlyformedcellsonlifespanfordifferentvaluesofSIRP-alphaexpressiononphagocytes*)
Out[]=
In[]:=
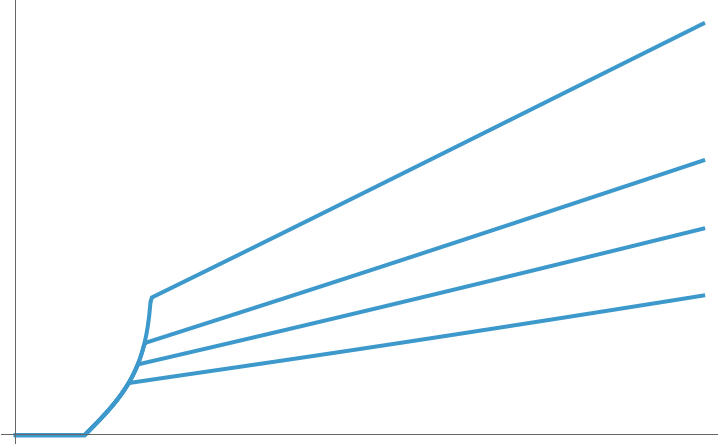
fig3E=Show[Map[ListLinePlot[Table[{c0,modelLifespan[{100,.05,10},{#,20,.1},{c0,.02,.5c0,2},{4,2,2},{400,400,100},{0,0,0}][[2]]},{c0,0,1000,2}],PlotRange->All]&,{0,1,2,4}],PlotRange->All,Ticks->False](*EffectofCD47levelsonnewlyformedcellsonlifespanfordifferentratesofC3bdeposition*)
Out[]=
In[]:=
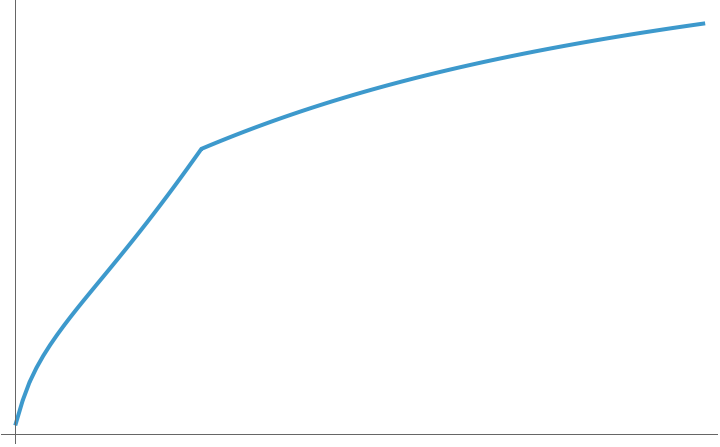
fig3G=ListLinePlot[Table[{r0,modelLifespan[{r0,.05,.2r0},{.2,20,.1},{600,.02,30,2},{1,.5,.5},{180,20,2},{0,0,0}][[2]]},{r0,0,10,.1}],PlotRange->All,Ticks->False](*Effectofcomplementregulatorsonlifespan*)
Out[]=
In[]:=
fig3H=Show[Map[ListLinePlot[Table[{c0,modelLifespan[{#,.05,.1#},{.2,20,.1},{c0,.02,.5c0,2},{4,2,2},{400,400,.5},{0,0,0}][[2]]},{c0,0,1500,2}],PlotRange->All]&,{140,120,100}],Ticks->False](*Effectofthedynamicsofcomplementregulatorsonlifespan*)
Out[]=
In[]:=
GraphicsGrid[{{fig3A,fig3B,fig3C,fig3D},{fig3E,fig3F,fig3G,fig3H}},ImageSize->1000]
Out[]=
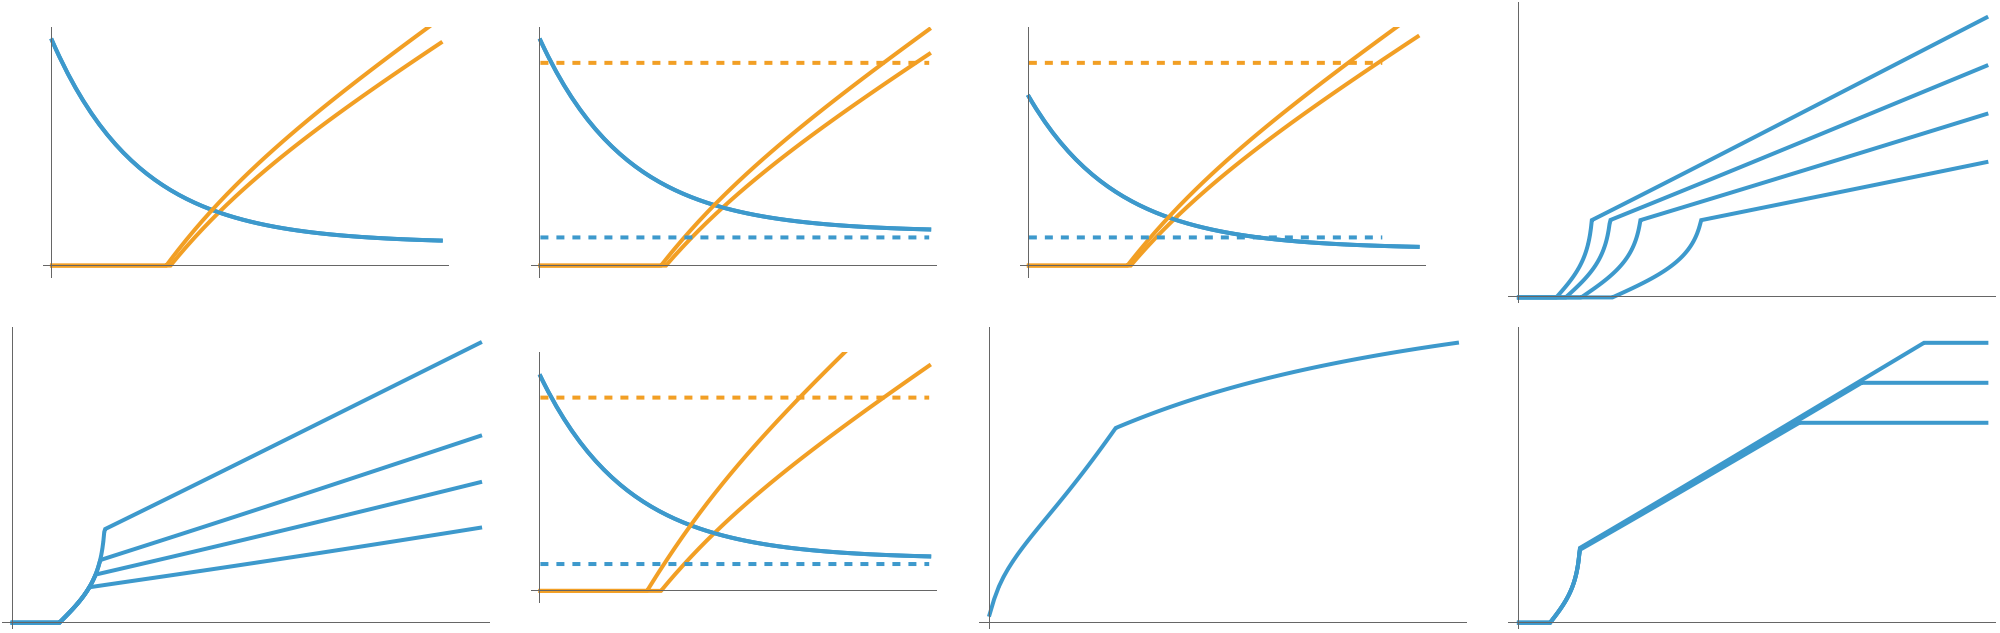
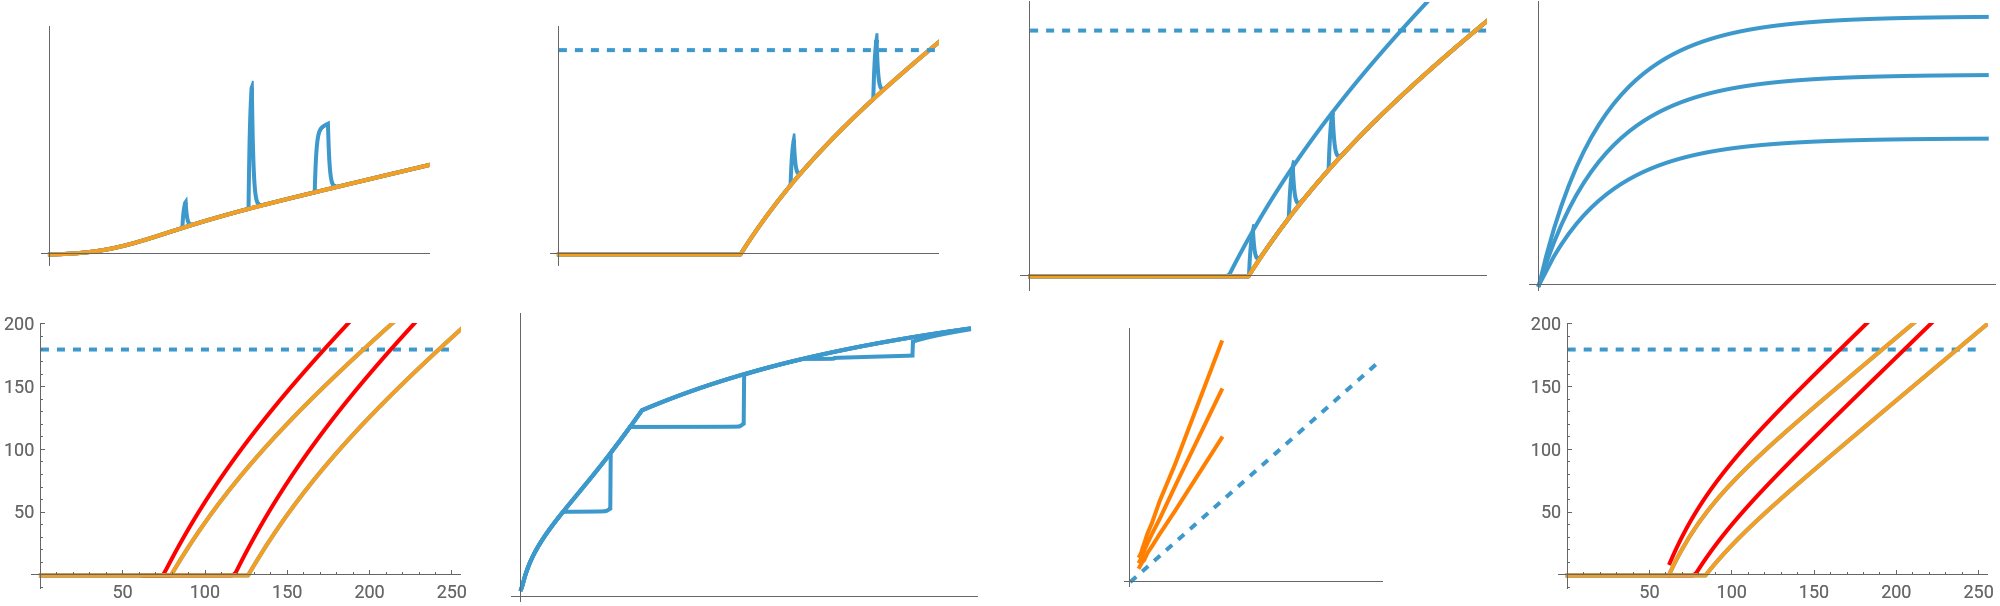
Figure 4
Figure 4
In[]:=
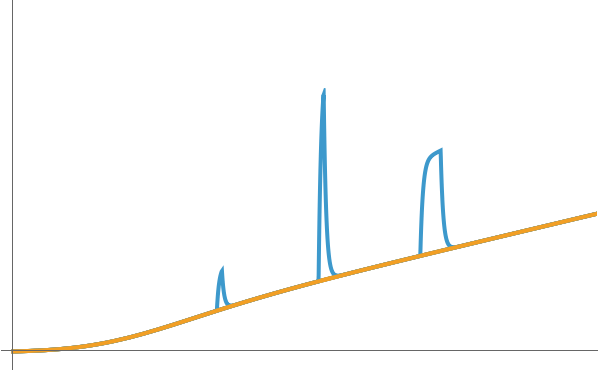
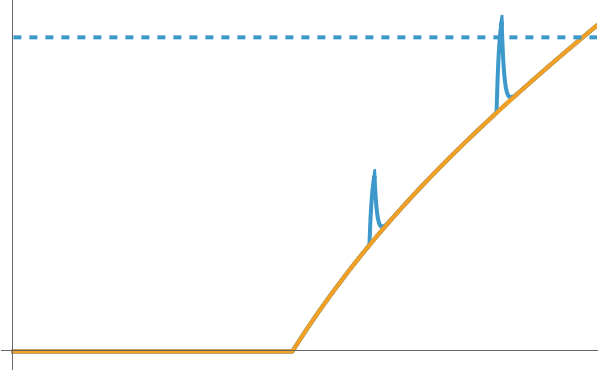
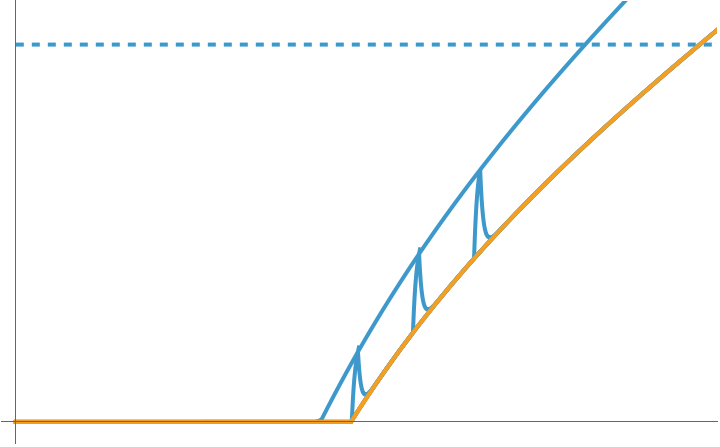
fig4[{r0_,λ_,μ_},{δ_,k1_,k2_},{c0_,λC_,μC_,ρ_},{sirp_,pr_,cr_},{t0_,t1_,α_}]:=Plot[{Evaluate[Max[0,Evaluate[-(sirpcd47[t]/.equations5[{r0,λ,μ},{δ,k1,k2},{c0,λC,μC,ρ},{t0,t1,α}])+pr(ps[t]/.equations5[{r0,λ,μ},{δ,k1,k2},{c0,λC,μC,ρ},{t0,t1,α}])+cric3b[t]/.equations5[{r0,λ,μ},{δ,k1,k2},{c0,λC,μC,ρ},{t0,t1,α}]]]],Evaluate[Max[0,Evaluate[-(sirpcd47[t]/.equations5[{r0,λ,μ},{δ,k1,k2},{c0,λC,μC,ρ},{0,0,0}])+pr(ps[t]/.equations5[{r0,λ,μ},{δ,k1,k2},{c0,λC,μC,ρ},{0,0,0}])+cric3b[t]/.equations5[{r0,λ,μ},{δ,k1,k2},{c0,λC,μC,ρ},{0,0,0}]]]]},{t,0,280},ImageSize->300](*Plotsthedynamisofeat-meanddon't-eat-mesignalsaccordingtoequations5*)
In[]:=
fig4A=Show[fig4[{100,.05,10},{.2,20,.1},{600,.02,60,2},{0,0,1},{80,82,2}],fig4[{100,.05,10},{.2,20,.1},{600,.02,60,2},{0,0,1},{160,168,2}],fig4[{100,.05,10},{.2,20,.1},{600,.02,60,2},{0,0,1},{120,122,4}],PlotRange->{{0,225},{0,110}},Ticks->False]
Out[]=
In[]:=
fig4B=Show[fig4[{100,.05,10},{.2,20,.1},{600,.02,60,2},{1,.5,.5},{140,142,4}],fig4[{100,.05,10},{.2,20,.1},{600,.02,60,2},{1,.5,.5},{190,192,4}],Plot[180,{t,0,230},PlotStyle->Dashed],PlotRange->{{0,225},{0,190}},Ticks->False]
Out[]=
In[]:=
Clear[peaks];peaks[{c0_,λC_,cmin_},{sirp_,pr_,cr_},{duration_,intensity_}]:=Table[maximum=FindMaximum[Evaluate[(-sirpcd47[t]+prps[t]+cric3b[t])/.equations5[{100,.05,10},{.2,20,.1},{c0,λC,cmin,2},{tresponse,tresponse+duration,intensity}]],{t,tresponse,tresponse+duration}];{t/.maximum[[2]],Max[0,maximum[[1]]]},{tresponse,60,250,2}];(*ThisfunctionreturnsthepeakofphagocytosissignalsfollowingatransientincreaseinC3bdeposition*)
In[]:=
fig4C=Show[Plot[180,{t,0,230},PlotStyle->Dashed],ListLinePlot[peaks[{600,.02,60},{1,.5,.5},{2,4}]],fig4[{100,.05,10},{.2,20,.1},{600,.02,60,2},{1,.5,.5},{150,152,4}],fig4[{100,.05,10},{.2,20,.1},{600,.02,60,2},{1,.5,.5},{130,132,4}],fig4[{100,.05,10},{.2,20,.1},{600,.02,60,2},{1,.5,.5},{110,112,4}],PlotRange->{{0,225},{0,190}},Ticks->False]
Out[]=
In[]:=
fig4E=Show[Plot[180,{t,0,250},PlotStyle->Dashed],ListLinePlot[peaks[{300,.02,30},{1,.5,.5},{2,3}],PlotStyle->Red],fig4[{100,.05,10},{.2,20,.1},{300,.02,30,2},{1,.5,.5},{0,0,0}],ListLinePlot[peaks[{800,.02,80},{1,.5,.5},{2,3}],PlotStyle->Red],fig4[{100,.05,10},{.2,20,.1},{800,.02,80,2},{1,.5,.5},{0,0,0}],PlotRange->{{0,250},{0,190}}]
Out[]=
In[]:=
fig4H=Show[Plot[180,{t,0,250},PlotStyle->Dashed],ListLinePlot[peaks[{800,.05,30},{1,.5,.5},{2,3}],PlotStyle->Red],fig4[{100,.05,10},{.2,20,.1},{800,.05,30,2},{1,.5,.5},{0,0,0}],ListLinePlot[peaks[{800,.05,80},{1,.5,.5},{2,3}],PlotStyle->Red],fig4[{100,.05,10},{.2,20,.1},{800,.05,80,2},{1,.5,.5},{0,0,0}],PlotRange->{{0,250},{0,190}}]
Out[]=
In[]:=
Off[InterpolatingFunction::dmval,Solve::ifun]
In[]:=
lifespans=Table[interpolation=Interpolation[Select[peaks[{600,.02,60},{1,.5,.5},{duration,2.}],145<#[[1]]<220&]];(*Interpolatesthepeaksofphagocytosissignalsfollowingatransient2xincreaseofC3bdeposition*)lifespan=t/.Solve[interpolation[t]==180,t][[1]];(*Theredbloodcellisphagocytizedwhenthedifferencebetweeneat-meanddon't-eat-mesignalsexceedsathreshold(TH=180)*){duration,lifespan},{duration,0.2,6.,.1}];
In[]:=
lifespans2=Table[interpolation=Interpolation[Select[peaks[{600,.02,60},{1,.5,.5},{duration,2.5}],145<#[[1]]<220&]];lifespan=t/.Solve[interpolation[t]==180,t][[1]];{duration,lifespan},{duration,.1,6.,.1}];(*sameaspreviousinputforadifferenintensityofC3bdeposition(2.5x)duringinfection*)
In[]:=
lifespans3=Table[interpolation=Interpolation[Select[peaks[{600,.02,60},{1,.5,.5},{duration,3}],145<#[[1]]<220&]];lifespan=t/.Solve[interpolation[t]==180,t][[1]];{duration,lifespan},{duration,.1,6.,.1}];(*sameaspreviousinputforadifferenintensityofC3bdeposition(3x)duringinfection*)
In[]:=
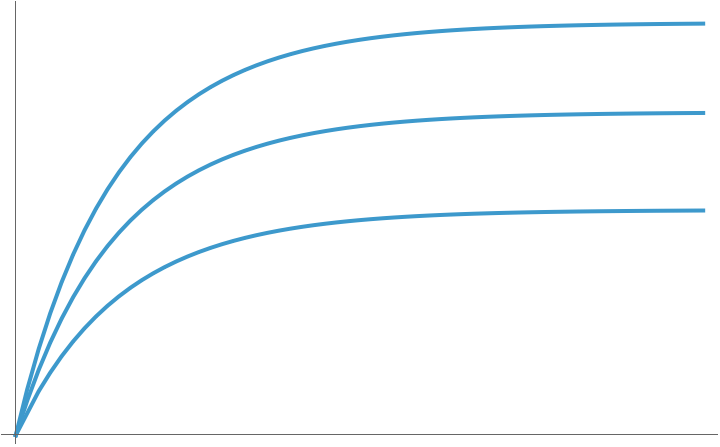
fig4D=(LifespanNoInfection=modelLifespan[{100,.05,10},{.2,20,.1},{600,.02,60,2},{1,.5,.5},{180,10,2},{0,0,0}][[2]];Show[ListLinePlot[Map[{#[[1]],(LifespanNoInfection-#[[2]])/LifespanNoInfection}&,Prepend[lifespans,{0,LifespanNoInfection}]],PlotRange->All],ListLinePlot[Map[{#[[1]],(LifespanNoInfection-#[[2]])/LifespanNoInfection}&,Prepend[lifespans2,{0,LifespanNoInfection}]],PlotRange->All],ListLinePlot[Map[{#[[1]],(LifespanNoInfection-#[[2]])/LifespanNoInfection}&,Prepend[lifespans3,{0,LifespanNoInfection}]],PlotRange->All],PlotRange->All,AxesOrigin->{0,0},Ticks->False])
Out[]=
In[]:=
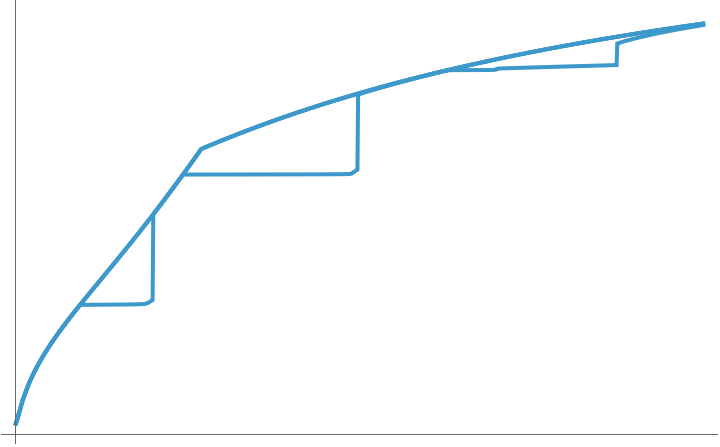
fig4F=Show[ListLinePlot[Table[{r0,modelLifespan[{r0,.05,.2r0},{.2,20,.1},{600,.02,30,2},{1,.5,.5},{180,20,2},{0,0,0}][[2]]},{r0,0,10,.1}],PlotRange->All],ListLinePlot[Table[{r0,modelLifespan[{r0,.05,.2r0},{.2,20,.1},{600,.02,30,2},{1,.5,.5},{180,20,2},{50,52,2}][[2]]},{r0,0,10,.01}],PlotRange->All],ListLinePlot[Table[{r0,modelLifespan[{r0,.05,.2r0},{.2,20,.1},{600,.02,30,2},{1,.5,.5},{180,20,2},{100,102,2}][[2]]},{r0,0,10,.01}],PlotRange->All],ListLinePlot[Table[{r0,modelLifespan[{r0,.05,.2r0},{.2,20,.1},{600,.02,30,2},{1,.5,.5},{180,20,2},{140,142,2}][[2]]},{r0,0,10,.01}],PlotRange->All],Ticks->False]
Out[]=
In[]:=
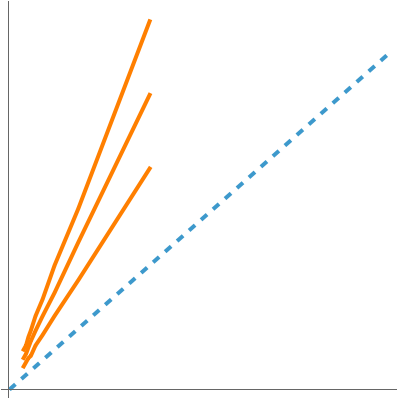
lysisThreshold0=Table[{p,Cases[Table[{r0,modelLifespan[{r0p,.05,pr0},{.2,20,.1},{200,.02,200×.5,2},{1,.5,.5},{180,20,2},{0,0,0}][[1]]},{r0,0,20,.1}],{_,2}][[-1,1]]},{p,.1,.9,.1}];(*Lysisthresholdintheabsenceofinfection*)
In[]:=
lysisThreshold1=Table[{p,Cases[Table[{r0,modelLifespan[{r0p,.05,pr0},{.2,20,.1},{200,.02,200×.5,2},{1,.5,.5},{180,20,2},{140,142,2}][[1]]},{r0,0,20,.1}],{_,2}][[-1,1]]},{p,.1,.9,.1}];(*Lysisthresholdifaninfectionoccursattime140,withduration=2andintensity=2*)
In[]:=
lysisThreshold2=Table[{p,Cases[Table[{r0,modelLifespan[{r0p,.05,pr0},{.2,20,.1},{200,.02,200×.5,2},{1,.5,.5},{180,20,2},{140,142,1.5}][[1]]},{r0,0,20,.1}],{_,2}][[-1,1]]},{p,.1,.9,.1}];(*Lysisthresholdifaninfectionoccursattime140,withduration=2andintensity=1.5*)
In[]:=
lysisThreshold3=Table[{p,Cases[Table[{r0,modelLifespan[{r0p,.05,pr0},{.2,20,.1},{200,.02,200×.5,2},{1,.5,.5},{180,20,2},{140,142,2.5}][[1]]},{r0,0,20,.1}],{_,2}][[-1,1]]},{p,.1,.9,.1}];(*Lysisthresholdifaninfectionoccursattime140,withduration=2andintensity=2.5*)
In[]:=
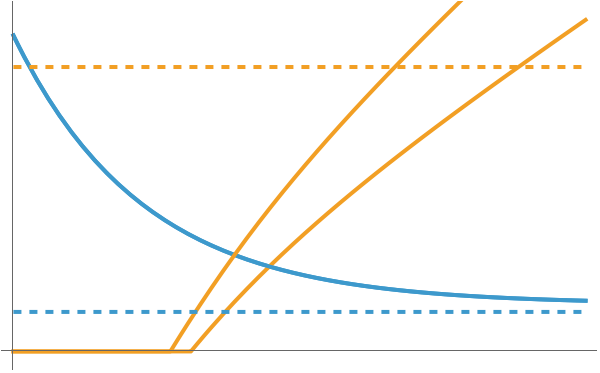
fig4G=Show[ListLinePlot[Transpose[{lysisThreshold0[[All,2]],lysisThreshold1[[All,2]]}],PlotRange->All,PlotStyle->Orange],ListLinePlot[Transpose[{lysisThreshold0[[All,2]],lysisThreshold2[[All,2]]}],PlotRange->All,PlotStyle->Orange],ListLinePlot[Transpose[{lysisThreshold0[[All,2]],lysisThreshold3[[All,2]]}],PlotRange->All,PlotStyle->Orange],Plot[x,{x,0,16},PlotStyle->Dashed],PlotRange->All,AxesOrigin->{0,0},AspectRatio->1,Ticks->False,ImageSize->200](*Plotslysisthresholdwithoutinfectionvs.lysisthresholdduringinfectionforthreedifferentintensitiesofC3increase*)
Out[]=
In[]:=
GraphicsGrid[{{fig4A,fig4B,fig4C,fig4D},{fig4E,fig4F,fig4G,fig4H}},ImageSize->1000]
Out[]=
Cite this as: Clemente Fernández Arias, "When blood needs to flow: The role of the complement system in red blood cell clearance during immune responses" from the Notebook Archive (2025), https://notebookarchive.org/2025-05-2sa0yis
Download
